New Tool Measures Vertical Equity in Property Tax Assessments

The coastal town of Ipswich, Massachusetts, 30 miles north of Boston, has about 6,000 homes built over the course of five centuries. There are the typical cul-de-sac Colonials, the new townhouses, and both modest and massive waterfront properties. But Ipswich is also awash in historic homes—including roughly five dozen “First Period” houses built before 1725, more than any other community in the United States. Lately, the town’s antique houses have been popular with homebuyers, fetching the kinds of multimillion-dollar sales prices usually associated with new construction.
Ipswich Chief Assessor Mary-Louise Ireland isn’t sure whether it’s a temporary blip or the start of a trend. But she does know one thing: it’s making her team’s task of assigning fair and accurate property tax values to every home in town a bit more challenging.
After all, one of the biggest difficulties for a local tax assessor isn’t just making accurate property valuations—it’s doing so consistently, across all price points, home styles, and neighborhoods. If a $1 million Colonial is assessed at $950,000, for example—or 95 percent of its market value—then a $100,000 condo in the same district should be assessed at $95,000. When that ratio is consistent across a community’s price tiers, the valuations have what’s called vertical equity.
That’s tricky enough to achieve in a homogenous postwar suburb. But when 300-year-old saltboxes share the streets with new luxury townhomes, and storied houses get converted to character-rich condos, making equitable assessments across such a sundry assortment of housing styles gets even more challenging. “We’re three people,” says Ireland, “and we do all of the field work on our own.”
Now, Ireland’s small department is using an innovative—and free—new online tool from the Lincoln Institute of Land Policy to evaluate and interpret the vertical equity of their assessments. “We don't have a lot of money for extra tools,” she says. “So having this has been fabulous.”
Evaluating the Valuations
Getting assessments right across the board is crucial to a fair and equitable property tax. But accurately assessing very low- and high-priced properties is notoriously difficult, partly because there are fewer market sales in those brackets. And in recent years, researchers analyzing national data sets have found headline-worthy evidence that lower-priced homes are being over-assessed—and therefore overtaxed—relative to higher-priced properties nearby.
“If assessments are equitable, then low-, medium-, and high-priced properties are all assessed at the same level relative to the market,” says Lincoln Institute of Land Policy fellow Ron Rakow. “But even though it's a fairly simple concept, vertical equity is really tricky to measure.”
The International Association of Assessing Officers (IAAO) has two vertical equity standards in place to guide assessors, says Rakow—former commissioner of the City of Boston Assessing Department—but even those measures are imperfect. The price related differential is a simple ratio most assessors use, but Rakow says it can be imprecise; the coefficient of price related bias is a little more robust, but also more complex—it requires a type of analysis that many small departments don’t have the resources or expertise to conduct.
“Because of the difficulty of measuring vertical equity, there's no single best, definitive measure,” Rakow says. “So rather than just looking at one indicator, it's better to look at several indicators to paint a more complete picture.”
Needless to say, that’s no simple undertaking. So the Lincoln Institute partnered with the nonprofit Center for Appraisal Research and Technology (CART) to develop a new online tool to help assessors measure and understand the vertical equity in their own valuations.
The browser-based vertical equity app, which is free to use, instantly analyzes property data that any local assessor already has on hand, evaluating it against six different measures of vertical equity and providing a detailed report. “We wanted to give assessors a tool where they can not only get these measures calculated out, but also get some assistance in interpreting them,” Rakow says.

The new tool, launched in September, simply requires users to upload a data set of assessment records, which are anonymized to protect the privacy of property owners. The tool then runs a calculation based on two main ingredients: time-adjusted sale prices and assessed values.
From there, assessors can see different illustrated measurements of vertical equity in their data set, with customized graphs and explanations, and can download a full PDF of the results.
“If you can upload an attachment to an email, you can now do these complex statistical quality control studies—you don't have to have a PhD, you don't even have to have programming experience,” says CART founder and research scientist Paul Bidanset. “There are a lot of different ways to do it that would have been more complicated—but we thought if we could meet people exactly where they were, we would be helping the most people.” (Read our profile of Bidanset, a former C. Lowell Harriss fellow at the Lincoln Institute.)
Ireland says she’s thrilled to have access to such a powerful tool. “It was super simple—I have everything in Excel spreadsheets anyway, and you only needed two columns,” she says. “I can use this really beautiful report to go before the Select Board and say, ‘OK, here's the data to support what we've done.’”
The professional look of the report was impressive, Ireland says—and not something her department of three could have put together on their own with their limited budget. And the illustrated graphs aren’t just useful for communicating vertical equity data to non-assessors. Paired with contextual explanations of what each measurement means and how it’s calculated, they helped Ireland wrap her head around some of the more complex and novel metrics. “I've taken all the classes, and we've talked about [these measurements], but for some reason it really hit home for me seeing it all put together this way,” she says.
Six Sides to Every Story
The tool provides results based on six approaches. The first looks at the commonly used assessment-to-sale ratio, which simply divides assessed values by their sale prices; the tool then sorts and charts those results into price deciles.
“We basically split all the sales into 10 bins—lowest-priced properties in the first bin and highest-priced properties in the tenth bin—and then we compare that ratio and see if it changes,” Rakow explains. “If we have proportional assessments, the ratio should be the same in each of those bins. But what we commonly see is that the assessment ratios tend to be a little bit higher for the low-priced properties than they are for high-priced properties.”
The coefficient of dispersion analysis plots out how far each property’s ratio is from the median. While that’s more commonly used as a measure of horizontal equity, Rakow says, it still reflects the overall quality of the assessments. “Generally speaking, if you have problems with vertical equity, you're also probably going to have a pretty high coefficient of dispersion,” he says.
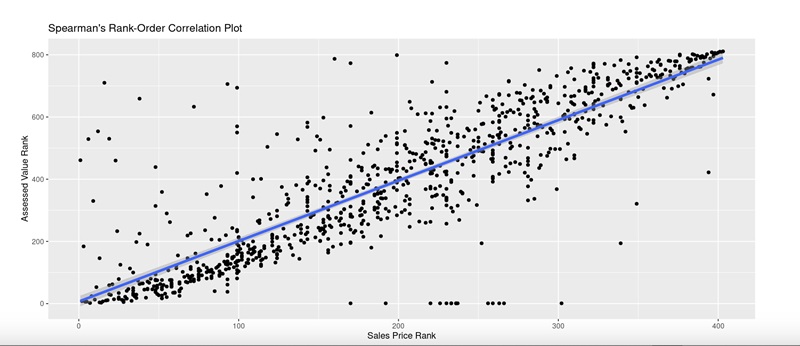
The tool also calculates the price related differential, one of two standards the IAAO uses to measure vertical equity (a PRD between 0.98 and 1.03 indicates vertical equity, according to IAAO guidance); the coefficient of price related bias, which can help users understand patterns in assessment-to-sales ratios at higher price points; and Spearman’s rank-order correlation, which compares rankings of assessments and sales from lowest to highest.
Finally, the tool includes Gini coefficients, which have long been used to measure inequality in economics. It’s only fairly recently that the assessment profession has begun to apply the Gini ranking technique to analyze vertical equity. “We're really excited about these,” Rakow says. The Gini ranking not only offers an overall indicator of equity in the assessments, “but it also can point to where in the price distribution you're actually having problems,” Rakow says. “It's great to know whether or not the assessment distribution is equitable or not, but it's even more important, if it isn't, to know where to start looking and where you may have some issues.”
While any one of these six measurements in isolation might provide an imperfect analysis of vertical equity, Rakow says, they offer a more complete picture when taken altogether. And the app can also help an assessor look more closely at specific data. “If you suspect that the issue may be in certain neighborhoods, or within certain housing styles, you could basically cull your sales file and just feed those types of properties into the app and see whether or not that is in fact the case, and how severe the problem is,” Rakow explains.
Ultimately, the developers of the tool hope that it will make it easier for assessors not just to understand vertical inequity, but to take steps to address it. In future iterations, Rakow would like to add diagnostic elements. One feature currently in development is a geographically weighted tool to highlight areas with the most significant divergences between market values and assessments. “So then you can zoom in and see what's going on there,” he says. “Maybe there's a certain style of house in that neighborhood that you're not capturing right in the model, or maybe it's very large homes that tend to be in that particular location versus the rest of the community.”
This kind of data could also help assessors make the case for their municipalities to consider targeted tax relief policies, such as a homestead exemption, that can help make assessments more equitable.
Like any good technology, the tool will never truly be finished, Bidanset says: “It'll always be changing and evolving as the industry evolves, and as we get more feedback, and as the industry comes up with new metrics and better statistics.”
Jon Gorey is a staff writer at the Lincoln Institute of Land Policy.
Lead image: Houses in Ipswich, Massachusetts. Credit: Leigh Mantoni-Stewart.