Precision Conservation
The Chesapeake Bay is a cultural icon, a national treasure, and a natural resource protected by hundreds of agencies, nonprofit organizations, and institutions. Now with unprecedented accuracy, a new ultra-high-resolution digital mapping technology, developed by the Chesapeake Conservancy and supported by the Lincoln Institute of Land Policy, is pinpointing pollution and other threats to the ecosystem health of the bay and its watershed, which spans 64,000 square miles, 10,000 miles of shoreline, and 150 major rivers and streams. At one-meter-by-one-meter resolution, the “precision conservation” mapping technology is gaining the attention of a wide range of agencies and institutions that see potential applications for a variety of planning purposes, for use throughout the United States and the world. This new land cover dataset, created by the Conservancy’s Conservation Innovation Center (CIC), has 900 times more information than previous datasets, and provides vastly greater detail about the watershed’s natural systems and environmental threats—the most persistent and pressing of which is pollution of the bay’s waters, which impacts everything from the health of people, plants, and wildlife to the fishing industry to tourism and recreation.
“The U.S. government is putting more than $70 million a year into cleaning up the Chesapeake but doesn’t know which interventions are making a difference,” says George W. McCarthy, president and CEO of the Lincoln Institute. “With this technology, we can determine whether interventions can interrupt a surface flow of nutrients that is causing algae blooms in the bay. We can see where the flows enter the Chesapeake. We’ll see what we’re getting for our money, and we can start to redirect the Environmental Protection Agency (EPA), the Department of Agriculture, and multiple agencies that might plan strategically but not talk to each other.”
The nonprofit Chesapeake Conservancy is putting finishing touches on a high-resolution map of the entire watershed for the Chesapeake Bay Program. Both organizations are located in Annapolis, Maryland, the epicenter of bay conservation efforts. The program serves the Chesapeake Bay Partnership, the EPA, the Chesapeake Bay Commission, and the six watershed states of Delaware, Maryland, New York, Pennsylvania, Virginia, West Virginia, and the District of Columbia—along with 90 other partners including nonprofit organizations, academic institutions, and government agencies such as the National Oceanic and Atmospheric Administration, the U.S. Fish and Wildlife Service, the U.S. Geologic Survey (USGS), and the U.S. Department of Defense.
On behalf of this partnership, EPA in 2016 invested $1.3 million in state and federal funding in the Conservancy’s high-resolution land cover project, which is being developed with the University of Vermont. Information gleaned from several precision mapping pilot programs is already helping local governments and river partners make more efficient and cost-effective land-management decisions.
“There are a lot of actors in the Chesapeake Bay watershed,” says Joel Dunn, president and CEO of the Chesapeake Conservancy. “We’ve been working on a very complicated conservation problem as a community over the last 40 years, and the result has been layers and layers and many institutions built to solve this problem.”
“Now it’s not a collective will problem but an action problem, and the whole community needs to be partnering in more innovative ways to take restoration of the watershed’s natural resources to the next level,” he adds.
“Conservation technology is evolving quickly and may be cresting now,” Dunn says, “and we want to ride that wave.” The project is an example of the Conservancy’s efforts to take its work to new heights. By bringing “big data” into the world of environmental planning, he says, the Conservancy is poised to further innovate as “conservation entrepreneurs.”
What Is Precision Mapping Technology?
Land use and land cover (LULC) data from images taken by satellites or airplanes is critical to environmental management. It is used for everything from ecological habitat mapping to tracking development trends. The industry standard is the USGS’s 30-by-30-meter-resolution National Land Cover Database (NLCD), which provides images encompassing 900 square meters, or almost one-quarter acre. This scale works well for large swaths of land. It is not accurate, however, at a small-project scale, because everything at one-quarter acre or less is lumped together into one type of land classification. A parcel might be classified as a forest, for example, when that quarter-acre might contain a stream and wetlands as well. To maximize improvements to water quality and critical habitats, higher resolution imaging is needed to inform field-scale decisions about where to concentrate efforts.
Using publicly available aerial imagery from the National Agriculture Imagery Program (NAIP), combined with LIDAR (or Light Detection and Ranging) land elevation data, the Conservancy has created three-dimensional land classification datasets with 900 times more information and close to a 90 percent accuracy level, compared to a 78 percent accuracy level for the NLCD. This new tool provides a much more detailed picture of what’s happening on the ground by showing points where pollution is entering streams and rivers, the height of slopes, and the effectiveness of best management practices (BMPs) such as bioswales, rain gardens, and forested buffers.
“We’re able to translate raw imagery to a classified landscape, and we’re training the computer to look at what humans see at eye level,” and even to identify individual plants, says Jeff Allenby, director of conservation technology, who was hired in 2012 to leverage technology to study, conserve, and restore the watershed. In 2013, a $25,000 grant from the Information Technology Industry Council (ITIC) allowed Allenby to buy two powerful computers and begin working on the digital map. With support from the Chesapeake Bay Program, his geographic information system (GIS)-savvy team of eight has created a classification system for the Chesapeake watershed with 12 categories of land cover, including impervious surfaces, wetlands, low vegetation, and water. It is also incorporating zoning information about land uses from the Chesapeake Bay Program.
The Technology’s Potential
Precision mapping “has the potential to transform the way we look at and analyze land and water systems in the United States,” says James N. Levitt, manager of land conservation programs for the department of planning and urban form at the Lincoln Institute, which is supporting the Conservancy’s development of the technology with $50,000. “It will help us maintain water quality and critical habitats, and locate the areas where restoration activities will have the greatest impact on improving water quality.” Levitt says the technology enables transferring “nonpoint,” or diffuse and undetermined, sources of pollution into specific identifiable “point” sources on the landscape. And it offers great potential for use in other watersheds, such as the Ohio and Mississippi river systems, which, like the Chesapeake watershed, also have large loads of polluted stormwater runoff from agriculture.
It’s a propitious time to be ramping up conservation technology in the Chesapeake region. In February 2016, the U.S. Supreme Court decided not to consider a challenge to the Chesapeake Bay Partnership’s plan to fully restore the bay and its tidal rivers as swimmable and fishable waterways by 2025. The high court’s action let stand a ruling by the 3rd U.S. Circuit Court of Appeals that upheld the clean water plan and reinforced restrictions on the total maximum daily load, or the permissible limit of pollution from substances like nitrogen and phosphorus. These nutrients, found in agricultural fertilizers, are the two major pollutants of the bay, and are addressed under federal water quality standards established by the Clean Water Act. The ruling also allows EPA and state agencies to fine polluters for violating regulations.
The Chesapeake Bay’s water quality has improved from its most polluted phase in the 1980s. Upgrades and more efficient operations at wastewater treatment plants have reduced nitrogen going into the bay by 57 percent and phosphorus by 75 percent. But the watershed states are still in violation of clean water regulations, and increasing urban development calls for constant assessment and pollution reduction in water and critical habitats.
Pilot Project No. 1: Chester River
Backed by funding from ITIC’s Digital Energy and Sustainability Solutions Campaigns, the Conservancy completed a high-resolution land classification and stormwater runoff flow analysis for the entire Chester River watershed on Maryland’s eastern shore. Isabel Hardesty is the river keeper for the 60-mile-long Chester River and works with the Chester River Association, based in Chestertown, Maryland. (“River keeper” is an official title for 250 individuals worldwide who serve as the “eyes, ears, and voice” for a body of water.) The Conservancy’s analysis helped Hardesty and her staff understand where water flows across the land, where BMPs would be most effective, and which degraded streams would be best to restore.
Two-thirds of the Chester River watershed’s land cover is row crops. Row-crop farmers often apply fertilizer uniformly to a field, and the fertilizer runs off with stormwater from all over the site. This is considered nonpoint pollution, which makes it harder to pinpoint the exact source of contaminants flowing into a river—compared to, say, a pile of manure. The Conservancy’s team mapped the entire Chester watershed, noting where rain fell on the landscape and then where it flowed.
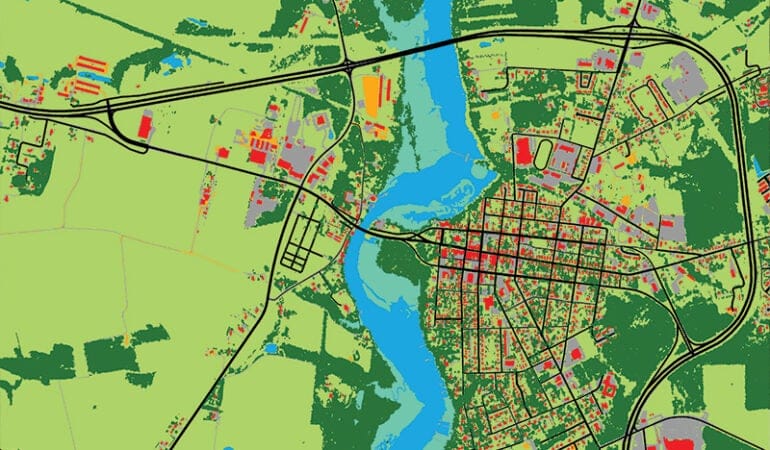
“With the naked eye, you can look at a field and see where the water is flowing, but their analysis is much more scientific,” says Hardesty. The map showed flow paths across the whole watershed, in red, yellow, and green. Red indicates higher potential for carrying pollutants, such as flow paths over impervious surfaces. Green means water is filtered, such as when it flows through a wetlands or a forested buffer, making it less likely to carry pollution. Yellow is intermediary, meaning it could go either way. The analysis has to be “ground-truthed,” says Hardesty, meaning the team uses the GIS analysis and drills down to an individual farm level to confirm what’s happening on a specific field.
“We are a small organization and have relationships with most of the farmers in the area,” says Hardesty. “We can look at a parcel of land, and we know the practices that farmers use. We’ve reached out to our landowners and worked with them on their sites and know where pollution may be entering streams. When we know a particular farmer wants to put a wetland on his farm, this land use and water flow analysis helps us determine what kind of BMP we should use and where it should be located.” The value of precision mapping for the Chester River Association, says Hardesty, has been “realizing that the best place to put a water intercept solution is where it’s best for the farmer. This is usually a fairly unproductive part of the farm.” She says farmers generally are happy to work with them to solve the problem.
The Chester River Association is also deploying the technology to use resources more strategically. The organization has a water monitoring program with years of watershed data, which the Conservancy team analyzed to rank streams according to water quality. The association now has GIS analysis that shows the flow paths for all stream subwatersheds, and is creating a strategic plan to guide future efforts for streams with the worst water quality.
Pilot Project No. 2: York County Stormwater Consortium BMP Reporting Tool
In 2013, the Conservancy and other core partners launched Envision the Susquehanna to improve the ecological and cultural integrity of the landscape and the quality of life along the Susquehanna River, from its headwaters in Cooperstown, New York, to where it merges with the Chesapeake Bay in Havre de Grace, Maryland. In 2015, the Conservancy selected the program to pilot its data project in York County, Pennsylvania.
Pennsylvania has struggled to demonstrate progress in reducing nitrogen and sediment runoff, especially in places where urban stormwater enters rivers and streams. In 2015, EPA announced that it would withhold $2.9 million in federal funding until the state could articulate a plan to meet its targets. In response, the Pennsylvania Department of Environmental Protection released the Chesapeake Bay Restoration Strategy to increase funding for local stormwater projects, verify the impacts and benefits of local BMPs, and improve accounting and data collection to monitor their effectiveness.
York County created the York County–Chesapeake Bay Pollution Reduction Program to coordinate reporting on clean-up projects. The Conservancy’s precision mapping technology offered a perfect pilot opportunity: In spring 2015, the York County Planning Commission and the Conservancy began working together to improve the process for selecting BMP projects for urban stormwater runoff, which, combined with increased development, is the fastest growing threat to the Chesapeake Bay.
The planning commission targeted the annual BMP proposal process for the 49 of 72 municipalities that are regulated as “municipal separate storm sewer systems,” or MS4s. These are stormwater systems required by the federal Clean Water Act that collect polluted runoff that would otherwise make its way into local waterways. The commission’s goal was to standardize the project submittal and review processes. The county had found that calculated load reductions often were inconsistent among municipalities because many lacked the staff to collect and analyze the data or used a variety of different data sources. This made it difficult for the commission to identify, compare, and develop priorities for the most effective and cost-efficient projects to achieve water-quality goals.
How to Use the York County Stormwater Consortium BMP Reporting Tool
To use the online tool, users select a proposed project area, and the tool automatically generates a high-resolution land cover analysis for all of the land area draining through the project footprint. High-resolution data is integrated into the tool, allowing users to assess how their project would interact with the landscape. Users also can compare potential projects quickly and easily, and then review and submit proposals for projects with the best potential to improve water quality. Users then input their project information into a nutrient/sediment load reduction model called the Bay Facility Assessment Scenario Tool, or BayFAST. Users enter additional project information, and the tool fills in the geographic data. The result is a simple, one-page pdf report that outlines the estimated project costs per pound of nitrogen, phosphorus, and sediment reduction. See the tool at: http://chesapeakeconservancy.org/apps/yorkdrainage/.
The Conservancy and planning commission collaborated to develop the user-friendly, web-based York County Stormwater Consortium BMP Reporting Tool (above), which allows different land use changes and restoration approaches to be compared and analyzed before being put into place. The Conservancy, commission, and municipal staff members collaborated on a uniform template for the proposals and data collection, and they streamlined the process with the same data sets. The Conservancy then trained a few of the local GIS professionals to provide technical assistance to other municipalities.
“It’s easy and quick to use,” explains Gary Milbrand, CFM, York Township’s GIS engineer and chief information officer, who is a project technical assistant for other municipalities. In the past, he says, municipalities typically spent between $500 and $1,000 on consultants to analyze their data and create proposals and reports. The reporting tool, he says, “saves us time and money.”
The commission required all regulated municipalities to submit BMP proposals using the new technology by July 1, 2016, and proposals will be selected for funding by late fall. Partners say the municipalities are more involved in the process of describing how their projects are working in the environment, and they hope to see more competitive projects in the future.
“For the first time, we can compare projects ‘apples to apples,’” says Carly Dean, Envision the Susquehanna project manager. “Just being able to visualize the data helps municipal staffs analyze how their projects interact with the landscape, and why their work is so important.” Dean adds, “We’re only just beginning to scratch the surface. It will take a while before we grasp all of the potential applications.”
Integrating Land Cover and Land Use Parcel Data
The Conservancy team is also working to overlay land cover data with parcel-level county data to provide more information on how land is being used. Combining high-resolution satellite imagery and county land use parcel data is unprecedented. Counties throughout the United States collect and maintain parcel-level databases with information such as tax records and property ownership. About 3,000 out of 3,200 counties have digitized these public records. But even in many of these counties, records haven’t been organized and standardized for public use, says McCarthy.
EPA and a USGS team in Annapolis have been combining the one-meter-resolution land cover data with land use data for the six Chesapeake states to provide a broad watershed-wide view that at the same time shows highly detailed information about developed and rural land. This fall, the team will incorporate every city and county’s land use and land cover data and determine adjustments to make sure the high-resolution map data matches local-scale data.
The updated land use and cover data then will be loaded into the Chesapeake Bay Watershed Model, a computer model now in its third of four beta versions of production and review. State and municipal partners, conservation districts, and other watershed partners have reviewed each version and suggested changes based on their experience in stormwater mitigation, water treatment upgrades, and other BMPs. Data will detail, for example, mixed-use development; different agricultural land uses for crops, hay, and pasture; and measures such as how much land produces fruit or vegetable crops. That’s where the conversion from land cover to land use comes in to help specify the pollution load rates.
“We want a very transparent process,” says EPA’s Rich Batiuk, associate director for science, analysis, and implementation for the Chesapeake Bay Program, noting that the combined land cover and land use data will be available online, at no cost. “We want thousands of eyes on land use and cover data. We want to help state and local partners with data on how we’re dealing with forests, flood plains, streams, and rivers. And we want an improved product that becomes the model for simulations of pollution control policies across the watershed.”
Scaling Up and Other Applications
As the technology is refined and used more widely by watershed partners, the Conservancy hopes to provide other data sets, scale up the work to other applications, and conduct annual or biannual updates so the maps reflect current conditions. “This data is important as a baseline, and we’ll be looking at the best way to be able to assess change over time,” says Allenby.
Watershed partners are discussing additional applications for one-meter-resolution data, from updating Emergency-911 maps, to protecting endangered species, to developing easements and purchasing land for conservation organizations. Beyond the Chesapeake, precision mapping could help conduct continental-scale projects. It offers the conservation parallel to precision agriculture, which helps determine, for example, where a bit of fertilizer in a specific place would do the most good for plants; the two combined could increase food production and reduce agriculture’s environmental impact. The technology could also help with more sustainable development practices, sea level rise, and resiliency.
Many people said it wasn’t feasible for a small nonprofit to do this kind of analysis, says Allenby, but his team was able to do it for a tenth of the cost of estimates. The bigger picture includes making land use and cover data available to the public for free. But that’s an expensive proposition at this point: The data needs backup, security, and a huge amount of storage space. Working with Esri, a Redlands, California-based company that sells GIS mapping tools, as well as Microsoft Research and Hexagon Geospatial, the Conservancy team is transferring the data. The process now runs linearly one square meter at a time. On a cloud-based system, it will run one square kilometer at a time and distribute to 1,000 different servers at once. Allenby says this could allow parcel-level mapping of the entire 8.8 million square kilometers of land in the United States in one month. Without this technology, 100 people would have to work for more than a year, at much greater cost, to produce the same dataset.
Precision mapping could bring greater depth to State of the Nation’s Land, an annual online journal of databases on land use and ownership that the Lincoln Institute is producing with PolicyMap. McCarthy suggests the technology might answer questions such as: Who owns America? How are we using land? How does ownership affect how land is used? How is it changing over time? What are the impacts of roads environmentally, economically, and socially? What changes after you build a road? How much prime agricultural land has been buried under suburban development? When does that begin to matter? How much land are we despoiling? What is happening to our water supply?
“Can it solve big social problems?” queries McCarthy. One of biggest outcomes of precision mapping technology would be to develop better ways to inform land use practices, he says, especially at the interface between people and land, and water and land. Land records are needed to use this technology most effectively, which might be challenging in some places because these records don’t exist or are inconsistent. But it’s a methology and technology that can be used in other countries, he says. “It‘s a game changer, allowing us to overlay land use data with land cover data, which could be hugely valuable to rapidly urbanizing places like China and Africa, where patterns and changes will be seen over the land and over time. It’s hard to exaggerate the impact.”
“Our goal is the world, to use this technology for transparency and accountability,” says McCarthy. “The more information planners have access to, the better stewards we can be for the planet.” The tool should be shared with “people who want to use it for the right purposes, so we’re making the value proposition that this is a public good that we all need to maintain,” he says, similar to the way USGS developed GIS.
“We need the right public-private arrangement, something like a regulated public utility with public oversight and support that will maintain it as a public good.”
Kathleen McCormick, principal of Fountainhead Communications, LLC, lives and works in Boulder, Colorado, and writes frequently about sustainable, healthy, and resilient communities.
Image by The Chesapeake Conservancy