Place Database
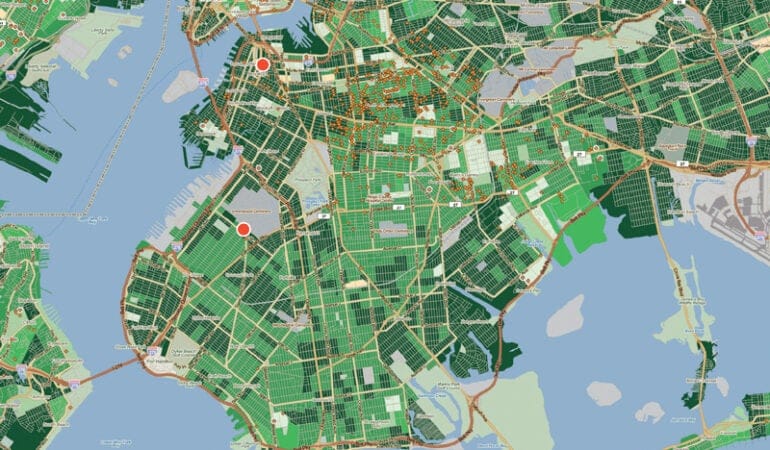
Median rent in Brooklyn climbed between two to six percent each month during the first half of 2019, reaching $2,914 by July, according to Bloomberg (Price 2019). As the map indicates, low-income housing tax credits (LIHTCs) tend to be clustered in the northeast section of the borough. Affordable housing is in short supply in the more westerly neighborhoods whose mixed-use library and housing projects are described in this issue: Brooklyn Heights, where average rent increased 53 percent from 1990 to 2010–2014, and Sunset Park, where average rent increased 24 percent during the same period (NYU 2016).
View the PDF version of this map for more detail and a key.
References:
NYU Furman Center. 2016. “State of New York City’s Housing and Neighborhoods in 2015.” New York: New York University. https://furmancenter.org/files/sotc/NYUFurmanCenter_SOCin2015_9JUNE2016.pdf.
Price, Sydney. 2019. “Brooklyn Beats Manhattan for NYC Apartment Rent Increases.” Bloomberg. July 11. https://www.bloomberg.com/news/articles/2019-07-11/brooklyn-beats-manhattan-for-new-york-apartmentrent-increases.