City Tech
Numina, a tech startup based in Brooklyn, New York, uses purpose-built sensors to gather data on pedestrian and bicyclist behavior, offering urban planners, policy makers, and mobility-focused businesses granular, anonymized information that can help shape new projects and tweak existing streetscape designs. While Numina has always focused on walkers and cyclists, its technology is proving useful for evaluating one behavior that wasn’t on anybody’s data-point wish list a year ago: social distancing.
It’s a modest but compelling example of how technology can help us see cities in different ways—and how the aftermath of the COVID-19 pandemic could shift the dialogue about the role of big data in planning and urban land use.
At the center of Numina’s service is a camera-like device designed to be installed using existing infrastructure, such as utility poles. The device collects video that’s run through Numina’s software, which distinguishes among cyclists, walkers, cars, buses, dogs, and other moving objects, then sorts the resulting data. Since its system was prototyped in St. Louis in 2015, with support from a Knight Foundation grant, Numina has focused on what it calls “curb-level activity”—gauging the impact of a specific traffic-calming project, for example, and thus complementing higher-level data such as the Census Bureau’s American Community Survey.
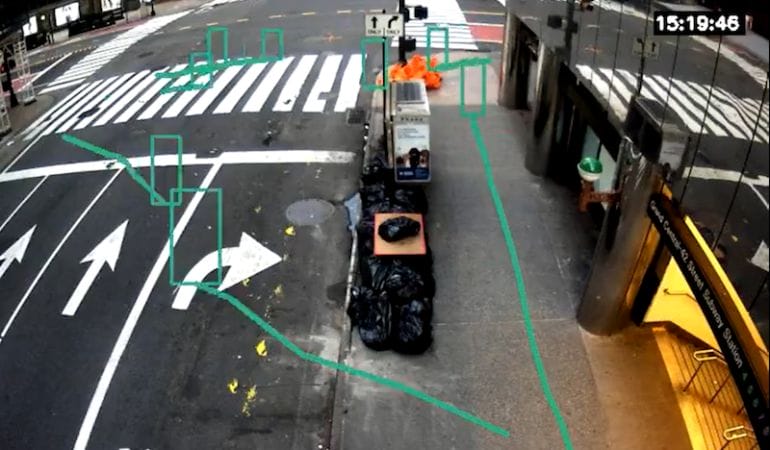
In March, as social distancing and lockdown orders were issued in response to the spread of the novel coronavirus in the United States, Numina already had sensors in place that were positioned to capture data demonstrating changes in actual urban travel behavior. Sensors in Golden Gate Park in San Francisco, for instance, tallied a massive shift from cars to bikes. And in New York, fascinating time-lapse video—with pedestrians and vehicles represented by colored boxes—showed the difficulty of keeping a six-foot distance from other people on a particular corner. Even with pedestrian traffic radically decreased from pre-lockdown levels in Manhattan, some walkers circled out into the street to avoid others. “Our data shows that New Yorkers are doing their best with #socialdistancing,” Numina tweeted. “But this snapshot from Saturday shows how difficult it can be, given limited sidewalk space.”
These data points added to a public discussion in multiple cities about closing streets to give walkers and cyclists more space to move safely. Numina CEO Tara Pham says the firm has been fielding an “unprecedented” number of inquiries from cities grappling with those issues. “Cities need new kinds of data to monitor social distancing behaviors, crowd density in public spaces, and adoption of new initiatives,” she says. “They are not planning for temporary interventions, but 18- or 24-month changes, or possibly permanent [changes].” That means the urgency of the pandemic may spark a new openness to using such data—sweeping sets, collected in almost real time via various technologies—as a more prominent planning tool.
“Cities have embraced a variety of 19th and 20th century modalities for understanding places and people: interviews, surveys, focus groups,” says Justin Hollander, a professor of urban and environmental policy and planning at Tufts University. Often those methods have served planners well, he continues. But they also have flaws and limitations. In recent years, even planners with no technical expertise have increasingly been able to access data “to understand what’s going on in our communities in ways that weren’t possible before.” Hollander addressed the potential for using data sets culled from social media and other sources in his 2016 book Urban Social Listening (supported in part by the Lincoln Institute). “Things have exploded since then,” he says—and that sense has only increased since the pandemic hit.
Another example of how our current crisis has surfaced existing data sets in new ways: Google’s recent release of Community Mobility Reports. As the company explained in a public statement, health officials trying to gauge the policy impact on individual movements needed to contain the virus could benefit from “the same type of aggregated, anonymized insights we use in products such as Google Maps.” If you use Google Maps, you know, for instance, that it can tell you when a restaurant or other business is busiest; that’s because many users (whether they realize it or not) have given the wildly popular app permission to track their movements. This creates the kind of massive data trove that can make Maps so helpful to its users.
And that means it’s also helpful to health officials (and really, to anyone) interested in knowing, down to the county level, the degree to which people are moving around. For instance, the Community Mobility Report for the Louisiana parish where I live shows me that in mid-April, people were visiting retail locations 62 percent less than they had been a month earlier. The New York Times has worked with mobile phone companies to create similar data visualizations.

Other projects abound. Computer vision startup Voxel51 analyzes live video streams of dense urban streets around the world to create a “physical distancing index” that, according to the company, “captures the average amount of human activity and social distancing behaviors in major cities over time.” Automated technology developed by Zensors, a firm with roots in Carnegie Mellon University’s Human-Computer Interaction Institute, is being used to analyze the feeds of available CCTV cameras to study social-distancing behavior.
While each of these entities, large and small, insists the data it collects is anonymized and non-invasive, some of this is bound to raise privacy concerns. Those concerns are real, and need to be dealt with seriously to maintain public trust. But over time, the creative and productive deployment of big data may result in a new receptiveness among policy makers to using data for planning—not only for near-term pandemic recovery efforts, but for longer-term projects and approaches.
Hollander recounts a recurring critique of data-driven planning efforts as lacking “the human touch.” But the key is that these new sources don’t replace traditional human input—they just make planners less reliant on it. And ultimately, that could lead to more inclusive planning. After all, plenty of city residents don’t want to answer survey or focus group questions, let alone attend community meetings. Their voices and insights are thus lost, and that can skew feedback outcomes.
“This new treasure trove of insight is going to fundamentally rework our understanding of human society,” Hollander says. “And it’s going to continue to play a really important role in shaping urban planning.”
What if neutral data could suggest different answers to, say, where that new bridge should go, or which buildings to target for preservation? Answers based not on selective feedback, but on evidence that is already being collected by tech companies? These coronavirus-era efforts are just the latest example of something that’s been underway for years. “You can really get a good handle on where people are, and where they’re going,” Hollander says. “The data’s there.”
Rob Walker is a journalist covering design, technology, and other subjects. He is the author of the book The Art of Noticing.
Images in order of appearance:
This still from a time-lapse video reveals social distancing patterns among pedestrians in New York City. Credit: Numina/@numina
Voxel51’s Physical Distancing Index (PDI) shows the impacts of the novel coronavirus on human behavior in real time. The company has created PDIs for major cities around the world. Credit: Voxel51/@Voxel51