City Tech
A 2012 United States Forest Service Study of urban tree cover estimated that American cities were losing around four million trees per year. Worldwide, agriculture, logging, and other factors eliminate 18.7 million acres of forest annually, according to the World Wildlife Fund. Yet the cost of that loss is hard to quantify. It’s widely recognized that plants absorb carbon dioxide, helping to mitigate the effects of climate change, but city planners could benefit from a more precise, data-driven assessment of the urban canopy’s value to guide how trees and other vegetation can most sensibly figure in the design and planning of the contemporary city.
After all, that’s how we evaluate and install gray infrastructure, counting every light pole and parking lot to help us think about how these elements work in a city’s design. Historically, we haven’t been as thoughtful or demanding about quantifying, and thus managing, green infrastructure, according to David Nowak, a senior scientist with the U.S. Forest Service.
As a rule, cities compile and track the details of the built infrastructure, but not trees. This makes it harder to plan for, or even debate, the various potential impacts of maintaining, increasing, or reducing urban vegetation.
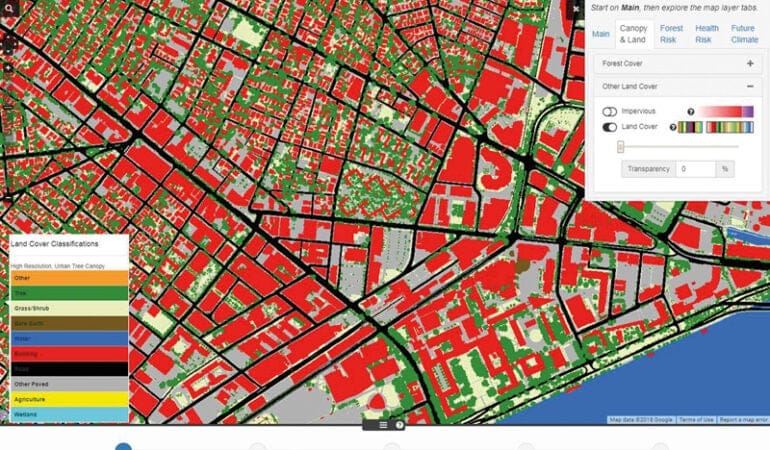
But that has been changing. Nowak leads a pioneering effort in the form of a Forest Service project called i-Tree, a suite of Web tools drawing in part on geographic information system (GIS) data. I-Tree combines satellite imagery and other data to help citizens, researchers, and officials understand urban canopies and other green infrastructure elements, often in economic terms.
For example, an i-Tree analysis of Austin, Texas, found that trees save the city about $19 million a year in residential energy use, $11.6 million in carbon capture, and almost $3 million in pollution removal. The city’s arboreal infrastructure produces oxygen and consumes carbon dioxide, for instance, adding up to a reduction in carbon emissions that i-Tree values at $5 million annually. Other tree payoffs—some quantified, others not—include absorbing ultraviolet radiation, helping absorb rainwater, and reducing noise pollution.
In another i-Tree analysis, conducted in 2017, researchers in the United States and Italy concluded that, worldwide, cities with populations over 10 million realize median annual savings of $505 million from reduced air pollution, mitigated “heat island” effects, and other benefits derived from their urban canopies.
This type of analysis can help cities deploy green resources for maximum impact and understand the tradeoffs involved in many planning decisions. Clearing trees to make way for a parking lot entails a loss, not just the gain associated with increased parking, Nowak noted.
In the past, trees were more likely a concern for the parks or forestry department. Increasingly, they’re central to cities’ responses to climate change. “I can tell you definitively that cities and towns across the nation are very interested in figuring out, whether or not you can talk about climate change politically, ‘What exactly are we going to do about it today?’,” said Jim Levitt, associate director of land conservation programs at the Lincoln Institute, and director of conservation innovation at the Harvard Forest. That’s true from New England to Miami to Newport News, Virginia, and Phoenix, he added, even if the specific reasons vary, whether flood issues, heat island effects, or others.
Recent arboreal infrastructure-related technology responds directly to this city-level interest. In late 2016, MIT’s Senseable City Lab, in collaboration with the World Economic Forum, launched a tool called Treepedia and has since published analyses of tree coverage in 27 cities around the world. In an interesting twist, it draws not on the satellite data behind many GIS projects, but on imagery culled from Google Street View. It offers a different skew on tree data, since, for example, it underrepresents large urban parks. But this is by design. The tool’s creators believe that detailing the “street greenery” citizens actually experience can inform the planning process. The lab will continue to add cities and has a backlog of requests from municipalities, academics, and others, according to Carlo Ratti, director of the MIT Senseable City Lab and founder of the design firm Carlo Ratti Associati.
“Cities are trying to acquire better information and understand the current state of the urban canopy,” Ratti said. “Most of them do not have the resources to manually survey the entire city. Treepedia data can give them a solid baseline” and focus efforts where they may be needed most. “Others, like planners and designers, find it useful as a proxy for measuring the perception of green space and trees by citizens,” he said, because it captures a kind of shared perspective “from the ground.” The lab will soon release an open-source version of its software to let cities, nongovernmental organizations, and community groups compile their own data. The hope is that NGOs and local groups will use Treepedia “as a tool to both determine where planting is needed and lobby their local governments with evidence-based campaigns,” Ratti explained.
This is consistent with a broader interest among citizens and planners in green city initiatives, including high-profile projects from New York to Atlanta and beyond. Nowak, of the i-Tree program, said that its tools helped guide the organizers of Million Trees NYC, a public-private initiative that increased New York’s aggregate urban forest by an estimated 20 percent. The London i-Tree Eco Project, according to its 2015 report, used i-Tree to quantify “the structure of the urban forest (the physical attributes such as tree density, tree health, leaf area, and biomass),” with a specific eye toward capturing its value “in monetary terms.” Carbon sequestration savings logged in at £4.79 million (roughly $6.75 million) annually, according to the report. “Our hope is to provide numbers that are locally derived, to help people make informed decisions—whether it’s pro or against trees,” Nowak said.
One i-Tree Web application, Landscape, is intended for planners in particular. Users can explore tree canopy, cross-matched with basic demographic information down to the census-block level, offering data related to pollution mitigation, temperature impacts, and other factors. For example, users can easily identify areas with high population density but low tree cover. The i-Tree project is adding data on tree species over the next year and is seeking feedback to modify the tool in ways that make most sense for planning, according to Nowak.
The broad idea is the same one that has shaped i-Tree from the start—a data-driven approach to thinking about green infrastructure. “We want to help answer the question: If I can plant only one tree or make one change to the city’s green landscape, where should I do it?” Nowak said.
Rob Walker (robwalker.net) is a columnist for the Sunday Business section of the New York Times.
Image credit: U.S. Forest Service