
Durante seis siglos, un pueblo llamado Hohokam habitó en el centro de Arizona. Entre muchos otros logros, crearon una especie de imperio hidráulico, como una telaraña de canales que debían llevar agua de los ríos Gila y Salado, afluentes del poderoso Colorado, hasta sus tierras agrícolas. Con el tiempo, los hohokam abandonaron sus campos y canales.
Hasta hoy, el motivo es incierto, pero el historiador Donald Worster supuso alguna vez que la tribu, productiva, pero condenada, “sufrió las consecuencias políticas y medioambientales de la grandeza” (Worster 1985).
Grandeza. Es la palabra perfecta para describir no solo la cuenca del río Colorado, sino también gran parte de la geografía, historia, cultura, política y desafíos asociados con ella.
El Colorado se destaca por su complejidad absoluta entre los ríos de los Estados Unidos de América, y tal vez del mundo. En esta cuenca, de 622.000 kilómetros cuadrados, un doceavo de la masa continental de EE.UU., existen grandes diversidades, lugares con temperaturas infernales y amplitud glacial. Toda esa extensión, salvo 5.200 kilómetros cuadrados, se encuentra en los Estados Unidos. Apenas un 10 por ciento de esa masa continental que, en gran parte, es una banda elevada de 2.700 a 3.300 metros en las Montañas Rocosas, produce el 90 por ciento del agua del sistema.
Abundan las infraestructuras hidráulicas en casi todos los codos de los 2.300 kilómetros del río. Los primeros desvíos ocurren en el nacimiento mismo, en el Parque Nacional de las Montañas Rocosas, antes de que el río se pueda considerar realmente un arroyo. En el río Colorado se erigieron catorce represas, y cientos más en sus afluentes. La represa Hoover debe ser la más conocida; es un gigante a media hora en auto de Las Vegas. El Buró de Reclamación de EE.UU. (USBR) la construyó en la década de 1930 para contener las inundaciones de primavera; así, creó un embalse que hoy se conoce como lago Mead. Unos 480 kilómetros río arriba, se encuentra el lago Powell, un segundo embalse masivo. Es el resultado de la represa del Cañón de Glen, construida en los 60 con el objetivo de ofrecer a los cuatro estados de la cuenca alta (Colorado, Nuevo México, Utah y Wyoming) un medio para almacenar el agua que habían acordado entregar a Arizona, California y Nevada, los estados de la cuenca baja, y a México.
En su capacidad máxima, ambos embalses (los más grandes del país) pueden contener cuatro años de caudal del río Colorado. Un artículo reciente sugiere que ambos embalses se podrían considerar como uno gigante, dividido por una “acequia gloriosa” (CRRG 2018). Esa acequia es el Gran Cañón, que este año celebra el primer centenario de haber sido declarado parque nacional.
Las represas, embalses, túneles y acueductos del Colorado proveen de agua a 40 millones de personas en siete estados de EE.UU. —más del 10 por ciento de los estadounidenses— y dos estados mexicanos. Además, el agua del río nutre a más de 2 millones de hectáreas de tierras agrícolas dentro y fuera de la cuenca. Los residentes de Denver, Los Ángeles y otras ciudades fuera de la cuenca dependen del río; las cosechas de campos que llegan prácticamente hasta Nebraska aprovechan las exportaciones y los desvíos por fuera de ella.
El río ofrece un recurso cultural y económico para 28 tribus dentro de la cuenca. En la cuenca y a su alrededor la economía mueve US$ 1,4 billones. Esto incluye los cañones innivadores de Vail y Aspen, el espectáculo hídrico nocturno del Bellagio, en Las Vegas, y la industria aeronáutica del sur de California. En toda la extensión del río hay más de 225 sitios recreativos federales que atraen a visitantes deseosos de probar suerte en pesca, canotaje o senderismo, o que solo quieren ver el paisaje. Este río y el territorio circundante tienen gran presencia en la imaginación pública.
Se trata de una red hidráulica grande, complicada y, ahora, vulnerable. A comienzos del s. XXI, el río ya era una esponja exprimida al máximo; el agua casi nunca llegaba al Golfo de California.
El veloz crecimiento demográfico, el aumento de la temperatura y la disminución de los caudales presionan al sistema y obligan a los administradores y usuarios a trazar planes creativos y vanguardistas que consideren tanto el suelo como el agua. El Centro Babbitt para Políticas de Suelo y Agua del Instituto Lincoln alienta este enfoque con brío. “Estamos intentando tener un pensamiento más holístico, al considerar la administración y la planificación de recursos de suelo y agua juntos”, dice Faith Sternlieb, gerente de programa en el Centro Babbitt. “Estas son las bases sobre las cuales se han considerado y creado las políticas hídricas en la cuenca del río Colorado, y estas son las raíces que debemos alimentar para un futuro hídrico sostenible”.
La doma del Colorado
La necesidad de alimentar las raíces ha empujado el desarrollo de la cuenca del río Colorado desde que las primeras personas comenzaron la labranza en el lugar. Los hohokam, mojave y otras tribus construyeron sistemas de canales de diversa complejidad para irrigar sus campos. A fines del s. XIX, nació el interés federal por intervenir el río para estimular la producción agrícola. Hacia 1902, el Departamento del Interior de EE.UU. (DOI, por sus siglas en inglés), había creado lo que hoy es el Buró de Reclamación. Durante el s. XX, el buró se convirtió en el principal constructor e inversor de proyectos sobre agua para agricultura en toda la cuenca.
La represa Laguna Diversion, la primera del río Colorado, empezó en 1904, y unos años más tarde entregaba agua cerca de Yuma, Arizona. Yuma está en el desierto de Mojave, donde se unen Arizona, California y México. Allí, las temporadas largas de crecimiento, casi sin heladas, se combinan con suelos fértiles y el agua del río Colorado, con lo cual la productividad es extraordinaria. Hoy, los productores agrícolas de la zona de Yuma, en Arizona, y el Valle de Imperial, en California, anuncian que, en invierno, cultivan entre el 80 y el 90 por ciento de los vegetales verdes y otros de los Estados Unidos y Canadá. La Coalición de Agua Agrícola del Condado de Yuma, en Arizona, declara que esta zona es para la agricultura del país lo que Silicon Valley es para la electrónica, y lo que Detroit era para los automóviles (YCAWC 2015).
En total, entre 1985 y 2010 la irrigación representó el 85 por ciento de toda el agua tomada de la cuenca (Maupin 2018). Hoy, la agricultura sigue representando entre el 75 y el 80 por ciento del total de agua extraída. Esta mantiene cultivos en línea, como maíz, y el cultivo perenne de alfalfa, que se siembra desde Wyoming hasta México. Gran parte de los cultivos van al ganado: en un informe de 2013, el Pacific Institute estimó que el 60 por ciento de la producción agrícola de la cuenca alimenta a ganado cárnico y lechero y a caballos (Cohen 2013). La agricultura siempre fue y seguirá siendo una parte esencial del rompecabezas del río Colorado (Figura 1).
Pero casi al instante que el Buró de Reclamación empezó a desviar agua para la agricultura, surgieron otras necesidades, desde producir electricidad hasta saciar la sed de la floreciente Los Ángeles. A principios de los 20, los siete estados del árido oeste del país se dieron cuenta de que debían encontrar una forma de compartir un río que se convertiría en “la masa de agua más disputada del país y, probablemente, del mundo”, según escribiría más tarde Norris Hundley, el fallecido excelso historiador del río (Hundley 1996). Años después, Hundley hizo una referencia famosa a la zona, como una “cuenca de contención” (Hundley 2009).
Hoy hay decenas de leyes, tratados y otros acuerdos y decretos llamados, en conjunto, la Ley del Río, que rigen el uso del agua de la cuenca del río Colorado. Estas incluyen leyes medioambientales federales, un tratado sobre la salinidad, enmiendas a tratados, un caso en la Corte Suprema de EE.UU. y convenios interestatales. Ninguno de ellos es más fundamental que el Convenio del Río Colorado de 1922, que aún hoy rige la proporción anual de agua que obtiene cada estado (Figura 2). Los representantes de los siete estados de la cuenca se encontraron para negociar las cláusulas en unas reuniones agotadoras cerca de Santa Fe. Los impulsaban la ambición y el miedo.
La ambiciosa California necesitaba fuerza federal para domar el río Colorado si quería alcanzar su potencial agrícola. Los Ángeles también tenía aspiraciones. En las primeras dos décadas del siglo, había crecido más del 500 por ciento y quería la electricidad que podría obtener de una represa grande en el río. Unos años más tarde, también decidió que quería el agua misma. Para pagar esta represa gigante, California necesitaba ayuda federal. El Congreso solo aprobaría dicha asistencia si California garantizaba el apoyo de los otros estados del sudoeste.
Los otros estados de la cuenca actuaron por miedo. Si en el río Colorado se aplicaba el sistema jurídico “primero en el tiempo, primero en derecho” de apropiación previa que utilizaban los estados occidentales, California y tal vez Arizona podrían cosechar todos los frutos. Los estados en la cabecera de la cuenca del río, entre ellos Colorado, se desarrollaban con demasiada lentitud como para beneficiarse de sus inviernos largos y nevosos. Delph Carpenter, un niño agrícola de Colorado que se convirtió en abogado hídrico, forjó el consenso. Se asignaron 9,2 kilómetros cúbicos a cada cuenca, la alta y la baja, con un total de 18,5 kilómetros cúbicos. México también necesitaba agua, y el convenio supuso que vendría de aguas excedentes. Un tratado posterior entre ambas naciones especificó que 1,8 kilómetros cúbicos irían para México.
Por otro lado, el Convenio del Río Colorado hacía una alusión, pero no más que eso, a lo que luego los escritores llamaron la espada de Damocles que pendía sobre estas asignaciones: agua para las reservas de las tribus indígenas de la cuenca. En 1908, la Corte Suprema de EE.UU. había declarado que, cuando el Congreso asignaba un territorio para una reserva, se asignaba de forma implícita agua suficiente para satisfacer el propósito de dicha reserva, lo que incluye la agricultura. Ese decreto no determinó las cantidades que se necesitaban. Hoy, los derechos de aguas de las tribus conforman 2,9 kilómetros cúbicos, y en muchos casos superan en prioridad a todos los otros usuarios en las asignaciones de los estados individuales (Figura 3). Es un quinto del caudal total del río. Es importante notar que aún no se resolvieron las asignaciones específicas para algunas de las tribus más grandes.
Los legisladores del convenio de 1922 incurrieron en una suposición grande y con un defecto fatal: que había suficiente agua para abastecer las necesidades de todos. Entre 1906 y 1921, el promedio de caudales anuales fue de 22,2 kilómetros cúbicos. Pero ya en 1925, apenas tres años después de la creación del convenio y a tres años de la aprobación en el Congreso, un científico del Servicio Geológico de EE.UU. llamado Eugene Clyde La Rue entregó un informe según el cual el río no podría entregar agua suficiente para satisfacer estas esperanzas y expectativas. Otros estudios del mismo momento llegaron a las mismas conclusiones.
Tenían razón. En un período más largo, entre 1906 y 2018, el río entregó en promedio 18,2 kilómetros cúbicos por año. Los promedios cayeron a 15,1 kilómetros cúbicos en el s. XXI, en medio de una sequía de 19 años. En el último año hídrico, que terminó en septiembre de 2018, el río alcanzó apenas 5,6 kilómetros cúbicos. Eso es 0,02 kilómetros cúbicos más de la asignación anual de California.
Un río compartido
A fines de 1928, el Congreso aprobó la Ley para el Proyecto del Cañón Boulder. La legislación logró tres puntos importantes: autorizó la construcción de una represa en el cañón Boulder, cerca de Las Vegas, que luego se llamó represa Hoover. También autorizó la construcción del Canal Todo Américano, esencial para desarrollar las productivas tierras de cultivo del Valle de Imperial, en California; hoy, esa zona es la principal usuaria del agua del río Colorado. Por último, la Ley para el Proyecto del Cañón Boulder dividió las aguas entre los estados de la cuenca baja: 5,4 kilómetros cúbicos al año para California, 3,4 kilómetros cúbicos para Arizona y 0,03 kilómetros cúbicos para Nevada. En ese momento, Las Vegas contaba con menos de 3.000 habitantes.
A medida que avanzó el s. XX, los estados en la cabecera del río también construyeron represas, túneles y más infraestructura hidráulica. En 1937, el Congreso aprobó financiar el proyecto Colorado-Big Thompson, lo que el historiador David Lavender consideró “una violación masiva a la geografía”, que pretendía desviar las aguas del río Colorado a granjas en el noreste de Colorado, por fuera de la cuenca hidrológica. En 1956, el Congreso aprobó la Ley sobre el Proyecto de Almacenamiento del Río Colorado y autorizó un puñado de represas, entre ellas la del Cañón de Glen.
Solo Arizona quedó afuera. Se había opuesto con fervor al convenio de 1922, y entonces, quedó como rebelde. Sus representantes en el Congreso se opusieron a la represa Hoover y, en 1934, el gobernador Benjamin Moeur llegó a enviar la Guardia Nacional del estado para oponerse de manera llamativa a la construcción de otra represa río abajo, que daría agua a Los Ángeles. “Para simplificarlo, los habitantes de Arizona temían que quedara poca agua para ellos luego de que la cuenca alta, California y México obtuvieran lo que querían”, explica Hundley (Hundley 1996). Al final, en 1944 (el mismo año en que EE.UU. y México llegaron a un acuerdo sobre la cantidad de agua que recibiría este último), los legisladores de Arizona sucumbieron a las realidades políticas. Se necesitaría cooperación, y no enfrentamientos, para que el estado obtuviera ayuda federal en el desarrollo de su parte del río. Por fin, el convenio tenía la firma de los siete estados.
Arizona acabó por recibir su gran porción de la torta del río Colorado en los 60. Una decisión de la Corte Suprema de EE.UU. de 1963 (uno de varios casos de Arizona contra California en varias décadas) confirmó que Arizona tenía derecho a 3,4 kilómetros cúbicos, tal como había especificado el Congreso en 1928, junto con toda el agua de sus propios afluentes. Esto es lo que Arizona había querido desde siempre. En 1968, el Congreso aprobó la financiación del masivo Proyecto de Centro Arizona, que dio como resultado la construcción de 494 kilómetros de acueductos de concreto para llevar agua del lago Havasu hasta Phoenix y Tucson, y los productores que se encontraran en el camino. California apoyó la autorización, con una condición: en tiempos de escasez, seguiría teniendo prioridad para hacer valer su derecho a 5,4 kilómetros cúbicos. Por está razon, Arizona luego estableció una autoridad bancaria para almacenar agua del río Colorado en acuíferos subterráneos, lo cual proporciona una seguridad al menos parcial ante futuras sequías.
Los estados de la cuenca alta habían llegado a un acuerdo sobre cómo distribuir sus 9,2 kilómetros cúbicos sin fricciones notables: Colorado 51,75 por ciento, Utah 23 por ciento, Wyoming 14 por ciento y Nuevo México 11,25 por ciento. Como explicó Hundley, usaron porcentajes debido a la “incertidumbre sobre cuánta agua quedaría una vez que la cuenca alta cumpliera con la obligación hacia los estados de la cuenca baja” y México. Consideraron que las fluctuaciones en el caudal del río podrían significar que algunos años tendrían menos de 9,2 kilómetros cúbicos para repartirse. En retrospectiva, fue una decisión sumamente sabia.
En todas partes y en ningún lado
El mismo año en que los estados de la cuenca formularon el Convenio original del Río Colorado, el gran naturalista Aldo Leopold recorrió el delta en canoa, en México. En un ensayo que luego se publicó en A Sand County Almanac, describió al delta como “una tierra virgen en que fluye leche y miel”. Escribió que el río en sí estaba “en todas partes y en ningún lado”, y que lo camuflan “cien lagunas verdes” en su viaje relajado hasta el océano. Seis décadas más tarde, el periodista Philip Fradkin visitó el delta después de medio siglo de trabajos febriles de ingeniería, construcción y administración que surgieron para darle un buen uso al agua del río; su percepción fue distinta. Tituló su libro A River No More (Ya no es un río).
A medida que concluía el s. XX, los impactos medioambientales de haber considerado al río básicamente como una cañería atrajeron nuevas miradas, en particular en el delta, que ya no tenía agua. Las lagunas que habían hechizado a Leopold ya no existían, porque, debido a la obstrucción del río, este ya no llegaba a su salida en el sur. El drenaje de grandes emprendimientos agrícolas lo había salinizado tanto que, entre otras cosas, México protestaba porque no podía utilizar el agua que recibía. La gran cantidad de represas y desvíos que se concretaron tras la visita de Leopold también habían llevado al borde de la extinción a 102 especies únicas de aves, peces y mamíferos que dependían del río, según se informó en Arizona Daily Star. El periódico elogió el trabajo de los interesados en un nuevo esfuerzo de conservación transfronterizo: “El principio fundamental de la ecología exige a los administradores del suelo que observen el bien del sistema entero, no solo de las partes”.
Los grupos ambientalistas podrían haber usado la Ley de Especies en Peligro de Extinción para imponer el debate de las soluciones, pero el delta no estaba dentro de los Estados Unidos. Entonces, intentaron encontrar soluciones de colaboración. En los últimos días del mandato de Bruce Babbitt, Secretario del Interior en el gobierno de Clinton quien dio nombre al Centro Babbitt (ver entrevista en página 10), ambos países adoptaron el Acta 306 de la Comisión Internacional de Límites y Agua. Esta creaba el marco para un diálogo que, con los sucesores de Babbitt en el gobierno de Bush, originó un acuerdo llamado Acta 319 y, en 2014, un flujo por pulso único de más de 0,01 kilómetros cúbicos para el río.
Durante ese flujo por pulso, en México los niños chapoteaban con alegría en las aguas escasas del río, pero los adultos de ambos lados de la frontera también compartían la celebración. Jennifer Pitt también sonreía; en ese momento pertenecía al Fondo para la Defensa del Medioambiente. Dijo que el litigio había sido un camino posible, pero era más productivo optar por un proceso inclusivo y transparente con los interesados.
“El marco institucional legal y físico que poseemos para el río Colorado es la base para una gran competencia y un potencial de litigios entre las partes”, dijo; hoy, está con Audubon. “Pero es el mismo marco exacto que dio a dichas partes la posibilidad de colaborar como alternativa a que una corte les dé las soluciones en una bandeja”.
El cambio de granjas a ciudades
La agricultura fue el mayor impulsor de desarrollo a lo largo del río Colorado. Según un informe reciente del Servicio Geológico de los Estados Unidos (USGS, por sus siglas en inglés), entre 1985 y 2010 el 85 por ciento de las extracciones de agua se destinaron a la irrigación. Los campos que rodean a Yuma, Arizona, y los valles de Imperial y Palo Verde de California consumen más de 4,9 kilómetros cúbicos de agua del río Colorado al año, casi un tercio de sus caudales anuales. Pero, con el crecimiento demográfico, el uso del agua pasó a satisfacer las necesidades urbanas. Por ejemplo, en Colorado, del agua importada del nacimiento del río Colorado mediante el proyecto Colorado-Big Thompson (CBT), el 95 por ciento se solía usar para la agricultura; hoy, esa proporción se acerca más al 50 por ciento. Otro ejemplo de la complejidad de los sistemas de la cuenca es que el agua del CBT se divide en unidades, que se pueden comprar y vender. La cantidad de agua de una unidad varía de año a año, según la cantidad total de agua disponible. Cuando el CBT está completo, una unidad son 1.233 metros cúbicos. Cuando, en los 50, las unidades se empezaron a comercializar, los usuarios agrícolas poseían el 85 por ciento de estas; pero hoy poseen menos de un tercio de las unidades disponibles. Los municipios poseen el resto, pero a veces alquilan el agua a las granjas hasta que se la necesite. El precio actual de una unidad del CBT es casi US$ 30.000.
Estos acuerdos para compartir el agua son cada vez más comunes en un sistema que ya está demasiado disminuido. El barbecho rotativo, conocido como retirada de tierras rotativas o mecanismos de transferencia alternativa, ha sido un agente en el cambio de agua de las granjas a las ciudades. Los productores del valle Palo Verde llegaron a un acuerdo con el Distrito Metropolitano de Agua del Sur de California, que atiende a 19 millones de clientes, para dejar sin explotar entre un 7 y un 35 por ciento de su territorio de forma rotativa. Los clientes metropolitanos, por su parte, reciben el agua, que se puede almacenar en el lago Mead. Existen tratos similares entre los municipios del sur de California y los productores del valle de Imperial, que están cargados de tensión, pero que se aceptan cada vez más. También entre ciudades y productores del corredor urbano Front Range, de Colorado.
Por su parte, las ciudades tienden a ofrecer labores de conservación y desarrollo que se llevan a cabo pensando en el agua (Figura 4). Muchas promueven la densidad y reducen el agua necesaria para la jardinería; algunas implementaron programas para eliminar el campo de césped; y los baños, duchas y otros aparatos son más eficientes (ver página 38 para obtener más detalles sobre cómo las ciudades integran el uso del suelo y el agua). El Distrito Metropolitano de Agua del sur de California alcanzó una reducción del 36 por ciento en el uso del agua per cápita entre 1985 y 2015, en una época de varias sequías, según indica la revista Planning (Best 2018).
En Nevada, la población abastecida por la Autoridad del Agua del Sur de Nevada aumentó en un 41 por ciento desde 2002, pero el consumo per cápita de agua del río Colorado descendió en un 36 por ciento.
Colby Pellegrino, que trabaja en la agencia, habló en una conferencia de septiembre de 2018 denominada “Risky Business on the Colorado River” (“Negocios arriesgados en el río Colorado”) y dijo que la conservación es la primera, segunda y tercera estrategia para lograr reducciones en el consumo de agua. “Si vives en el valle de Las Vegas, donde hay menos de 102 milímetros de precipitaciones al año, posees una mediana cubierta de césped, y la única persona que camina por ella es quien empuja la cortadora de césped, ese es un lujo que la comunidad no puede costear si queremos continuar con la economía que tenemos hoy”, dijo.
La economía, la cultura y los valores fueron el centro del debate en toda la cuenca sobre cómo responder a la sequía. No hay ningún sector ni región que pueda absorber la carga completa de las reducciones necesarias, y es evidente que todos deben empezar a pensar de otro modo. Andy Mueller, gerente general del Distrito de Conservación de Agua del Río Colorado, habló en la conferencia “Risky Business” y lo explicó de este modo: en vez de uso intencional del agua, hoy Colorado habla del no uso intencional del agua. Al igual que todos los que viven y trabajan en la cuenca del río Colorado.
La colaboración es esencial
Cuando llegó el nuevo siglo, los embalses estaban llenos, gracias a una nevada importante en las Rocosas en los 90. Pero seguía habiendo tensión. Durante décadas, California había excedido su porción de 5,4 kilómetros cúbicos; el pico fue en 1974: consumió 6,6 kilómetros cúbicos. Los estados de la cuenca alta nunca desarrollaron del todo sus 9,2 kilómetros cúbicos: desde los 80 tuvieron un promedio de 4,5 a 4,9 kilómetros cúbicos, además de 0,06 kilómetros cúbicos de evaporación del embalse.
Y luego llegó la sequía, pronunciada y extensa. En 2000, el caudal del río fue de apenas el 69 por ciento. El invierno de 2001 a 2002 fue aun más miserable: el río entregó apenas 7,2 kilómetros cúbicos, un 39 por ciento del promedio, en el lago Powell. El período entre 2000 y 2004 tuvo el caudal acumulado de cinco años más bajo en los registros observados. Desde entonces, hubo más años secos que húmedos. Los embalses tienen niveles bajos muy cercanos a los récords mínimos.
El convenio de 1922 no había contemplado este tipo de sequías a largo plazo. Se hizo muy evidente que había un “déficit estructural”. Tom McCann, vice gerente general del Proyecto de Centro Arizona, fue quien acuñó la frase. Para simplificarlo, todos los años los estados de la cuenca baja usaban más agua de la que entregaba el lago Powell. Esto ocurrió también cuando el Buró de Reclamación autorizó la liberación de caudales adicionales de “compensación” desde Powell.
“Las liberaciones de compensación son como sacar el premio mayor en las tragamonedas”, dijo McCann. “En ese momento, sacábamos el premio cada tres, cuatro o cinco años, y pensábamos que no había nada de qué preocuparse”. Incluso con los premios mayores, el lago Mead seguía empeorando: las marcas de nivel del embalse, como las de una bañera, ilustraban las pérdidas.
El cambio climático se superpone con el déficit estructural. Los científicos argumentan que el aumento de las temperaturas es un golpe muy grande para la cuenca del río Colorado. Denominan a las disminuciones de principios del s. XXI “sequía caliente”, que son distintas a las “sequías secas”.
La perspectiva de esta sequía nueva y “caliente”, inducida por el hombre, además de una sequía convencional, preocupa a muchos. Los estudios de anillos de los árboles demuestran que la región ha sufrido sequías más largas y pronunciadas, antes de que comenzaran las mediciones. “Varias personas afirman que el período actual de 19 años, de 2000 a 2018, es el más seco en el río Colorado”, dice Eric Kuhn, ex gerente general del Distrito de Conservación de Agua del Río Colorado. “Son tonterías. Ni se le acerca. Si esas últimas sequías sucedieran con las temperaturas de hoy, las cosas estarían mucho peor”.
En las primeras dos décadas del nuevo milenio, se observaron una serie de labores para enfrentar esta nueva realidad. En 2007, el Departamento del Interior emitió pautas provisorias ante la escasez, la primera respuesta formal a la sequía. En 2012, el Buró de Reclamación emitió un Estudio de Oferta y Demanda en la Cuenca, un esfuerzo exhaustivo por ofrecer una plataforma para decisiones futuras. La gran cantidad de informes llenaba una caja donde podría caber una pelota de fútbol americano. Debatían el crecimiento demográfico, el aumento de temperaturas y el impacto de las mayores precipitaciones en la carga nival. El estudio concluyó que, para 2060, la demanda excedería a la oferta en 3,9 kilómetros cúbicos (USBR 2012).
“Se pueden objetar los números, se puede objetar el pronóstico, pero eso llamó la atención de todos”, dice Anne Castle, de Colorado, quien en ese momento era subsecretaria del Interior para el agua y la ciencia. “Fue como un catalizador para concentrar el debate acerca de la administración del río Colorado de forma más directa al lidiar con la futura escasez”.
Castle observa que hoy la cuenca lucha por encontrar soluciones en colaboración. “En un sistema hídrico complejo, hay muchas partes móviles, no hay una única respuesta”, dijo. “Se debe administrar un sistema complejo, y eso solo se puede hacer mediante acuerdos negociados”.
Esas negociaciones suceden en este momento, en forma de planificación de contingencia ante sequías (ver página 26). A medida que la escasez se hizo más pronunciada, también creció la colaboración. Pero la vara con la que se mide el éxito bien podrían ser las paredes blancas mineralizadas del lago Mead, un gran embalse en una gran cuenca que enfrenta grandes desafíos. Hoy, los siete estados, las tribus y los gobiernos de EE.UU. y México, con aportes de organizaciones medioambientales y otras no gubernamentales, deben descifrar cómo evitar que esos niveles de agua bajen aun más. Deben elaborar un plan que garantice un futuro sostenible y, al mismo tiempo, atender los giros del pasado.
Allen Best escribe sobre agua, energía y otros temas desde una base en el área metropolitana de Denver; allí, el 78 por ciento del agua proviene de la cuenca del río Colorado.
Fotografía: Lago Powell detrás de la represa del Cañón de Glen. Crédito: Pete McBride
Referencias
Arizona Daily Star. 1998. “Don’t Ignore Colorado Delta.” 6 de mayo de 1998.
Best, Allen. 2018. “Water Pressure: Smart Management Is Key to Making Sure Inland Cities Aren’t Left High and Dry in the Face of a Warming Climate.” Planning agosto/septiembre: 40–45. https://www.planning.org/login/?next=/planning/2018/aug/waterpressure.
Cohen, Michael, Juliet Christian-Smith y John Berggren. 2013. Water to Supply the Land: Irrigated Agriculture in the Colorado River Basin. Oakland, CA: Pacific Institute (mayo). http://pacinst.org/publication/water-to-supply-the-land-irrigated-agriculture-in-the-colorado-river-basin.
CRRG (Colorado River Research Group). 2018. “It’s Hard to Fill a Bathtub When the Drain is Wide Open: The Case of Lake Powell.” Boulder, CO: Colorado River Research Group (agosto). https://www.coloradoriverresearchgroup.org/uploads/4/2/3/6/42362959/crrg_the_case_of_lake_powell.pdf.
Fradkin, Philip. 1996. A River No More: The Colorado River and the West. Oakland, CA: University of California Press.
Hundley, Norris Jr. 1996. “The West Against Itself: The Colorado River—An Institutional History.” En New Courses for the Colorado River: Major Issues for the Next Century, ed. Gary D. Weatherford y F. Lee Brown. Albuquerque, NM: University of New Mexico Press. http://web.sahra.arizona.edu/education2/hwr213/docs/Unit1Wk4/Hundley_CRWUA.pdf.
———. 2009. Water in the West: The Colorado River Compact and the Politics of Water in the American West. Oakland, CA: University of California Press.
Leopold, Aldo. 1949. A Sand County Almanac: And Sketches Here and There. Nueva York, NY: Oxford University Press.
Maupin, Molly A., Tamara Ivahnenko y Breton Bruce. 2018. “Estimates of Water Use and Trends in the Colorado River Basin, Southwestern United States, 1985–2010.” Reston, Virginia: Servicio Geológico de EE.UU. https://pubs.er.usgs.gov/publication/sir20185049.
USBR (Buró de Reclamación de los EE.UU.) 2012. “Colorado River Basin Supply and Demand Study.” Washington, D.C.: Departamento del Interior de EE.UU. https://www.usbr.gov/lc/region/programs/crbstudy/finalreport/Study%20Report/CRBS_Study_Report_FINAL.pdf.
Worster, Donald. 1985. Rivers of Empire: Water, Aridity, and the Growth of the American West. Nueva York, NY: Pantheon Books.
YCAWC (Coalición de Agua Agrícola del condado de Yuma). 2015. “A Case Study in Efficiency: Agriculture and Water Use in the Yuma, Arizona Area.” Yuma, AZ: Coalición de Agua Agrícola del condado de Yuma (febrero). https://www.agwateryuma.com/wp-content/uploads/2018/02/ACaseStudyInEfficiency.pdf.

Last fall, Las Vegas completed a yearlong pilot of the nation’s first public self-driving shuttle. Over the course of the experiment, more than 32,000 people hopped aboard a blue electric minibus bearing the slogans, “The future is here” and “Look ma no driver.” Designed and built by French start-up Navya and operated by Keolis North America, the eight-passenger shuttle took riders on a 0.6-mile loop through the downtown area. A human operator rode along, poised to override vehicle functions in an emergency using a converted Xbox controller.
Las Vegas partnered with the regional transit agency and AAA to run the pilot, which was deemed a success. Now accelerating its commitment to autonomous vehicles (AVs), the city is planning for a second shuttle route and a “robotaxi” service by Keolis and Navya. And in December, the city and transit agency won a $5.3 million grant from the U.S. Department of Transportation for a project called GoMed. Slated to begin in late 2019, GoMed will provide four autonomous electric shuttles on a four-mile route between downtown and the Las Vegas Medical District. That district includes four hospitals and the University of Nevada at Las Vegas School of Medicine campus, which serves 200,000 patients annually and will employ 6,000 people by 2020. GoMed will also feature pedestrian safety devices and 23 smart transit shelters with Wi-Fi, information on shuttle arrival times and occupancy, and wayfinding kiosks.
When it comes to AVs, Las Vegas appears to be all in—but planning for the impacts of rapidly emerging technology can be complicated. In a Big City Planning Directors Institute session on AVs hosted last fall by the Lincoln Institute of Land Policy, the American Planning Association (APA), and the Harvard Graduate School of Design (GSD), Las Vegas Planning Director Robert Summerfield acknowledged that it is challenging to regulate new mobilities and incorporate them into the urban fabric. This is especially true now, he says, when leaders in Las Vegas are juggling a citywide master planning process, form-based code regulations, thoroughfare standards, transit system changes, and downtown capital projects—all of which could need adjustments as new mobility options become more popular.
It’s an era of contrasts: Public transit is enjoying a surge in metro areas, with expanding light-rail systems in Denver, Los Angeles, and other places, and demand for walkable and bikeable urban spaces is at an all-time high. At the same time, ride-hailing services like Uber and Lyft (which are also known as transportation network companies, or TNCs) have actually increased traffic congestion and vehicle miles traveled (VMT). So how do AVs fit into the picture, and what will they mean for cities? How are planning, transportation, and public works departments adjusting to this rapidly changing mobility landscape, and how can they ensure that the built environment will accommodate changes that haven’t yet happened?
At the Planning Directors Institute, Andres Sevtsuk, assistant professor of urban planning and director of the City Form Lab at the Harvard Graduate School of Design (GSD), illustrated the “totally transformative” nature of AVs with an example from the past: When the Model T was introduced, he said, no one could have predicted that we would have 41,000 miles of interstate highways across the United States decades later. It’s just as difficult to predict the impact of AVs.
With so much buzz and uncertainty, the art appears to lie, at this point, not in finessing the AV future, but in managing the next few years of transition. Cars notoriously reshaped our cities in the twentieth century—the question is how AVs will reshape them in the twenty-first.
Transformative Technology
“We know from our work with big city planning directors across the country that autonomous vehicles are seen as a disruptive technology that will require preparing for a range of impacts—both positive and negative—related to transportation systems and travel modes, land use and urban design, and access for low-income and underserved communities,” says Armando Carbonell, chair of Planning and Urban Form at the Lincoln Institute. Carbonell notes that these topics will be featured in a panel at APA’s 2019 National Planning Conference in San Francisco, with speakers including Los Angeles Planning Director Vince Bertoni and New York City Planning Director Anita Laremont, as well as experts from the fall Planning Directors Institute.
Many other organizations are thinking through the impacts of AVs, including Bloomberg Philanthropies and The Aspen Institute, which issued a joint report on the topic. “Automation is changing the automobile, mostly in ways that will help cities,” notes the report (Bloomberg 2017). “Cities have long struggled with the car’s demands for space. But AVs can be designed for many more forms and functions, creating new opportunities to right-size vehicles for urban use.” While most AV pilots in the last decade focused on high-speed highways, “the AV’s future is in cities, where its biggest market demographics are concentrated,” the report notes.
This shift seems to align with the values of urban-dwellers, especially younger generations; in a recent consumer survey by Arity, a data start-up launched by Allstate, 59 percent of respondents between 22 and 37 years old say they’d rather spend time doing more productive tasks than driving, 51 percent don’t think owning a car is worth the investment, and 45 percent regularly use ride-hailing services (Arity 2018).
“AVs are coming just as our demographics and economy are very pro-urban for the next 20 years,” says David Dixon, Urban Places Planning and Urban Design Leader at the global design and engineering firm Stantec, who also presented at the Planning Directors Institute. “Change will come much faster in urban centers than in suburbs or rural areas because of a critical mass that allows for shared vehicles.”
That change is beginning to occur. After a decade of research and development, tech companies and car manufacturers (also known as OEMs, or original equipment manufacturers) are readying self-driving vehicles for market at a remarkable pace, with fully autonomous vehicles scheduled to roll out this year in pilot programs across the United States. Small self-driving shuttle buses like the one in Las Vegas have appeared in pilot programs on city streets across the U.S., including Providence, Rhode Island, and Columbus, Ohio, and single-occupant AVs have been tested in many cities from Boston to San Jose. Half of America’s largest cities are preparing for self-driving vehicles in their long-range transportation plans, according to a National League of Cities report on autonomous vehicle pilots, which noted that at least 28 states were introducing legislation to support such AV pilots (Perkins 2018).
More comprehensive testing programs are also underway in cities including Austin and Phoenix. The Austin Transportation Department is testing technology at five intersections that will allow the city’s traffic system to communicate with self-driving cars. Installed over the streets on traffic-light equipment, the technology can inform AVs about when the light is about to turn, if a driver has run a red light, or if pedestrians are present.
The Phoenix metro area also has evolved as an AV-testing hub for tech companies and OEMs thanks to its road infrastructure, weather, cross-border supply chain, favorable business climate, and access to tech talent. The Phoenix metro area boasts 15 companies that are innovating and testing driverless vehicles and related technology, according to the Greater Phoenix Economic Council, which says the AV industry will bring Arizona 2,000-plus jobs and $700 million in capital investment by 2020.
Waymo, launched by Google, has tested vehicles in autonomous mode for over 10 million miles on public roads in 25 cities across the U.S., in various conditions from sunny California to snowy Michigan and on the high-speed roads around Phoenix. A test group of 400 “early rider” volunteers have been riding Waymo’s Chrysler Pacifica minivans, modified and equipped with safety drivers, for more than a year in the Phoenix suburbs of Chandler, Gilbert, Mesa, and Tempe. (In 2018, Tempe was the site of the first pedestrian fatality caused by an AV. Uber, which had been testing the vehicle, temporarily suspended its AV operations.)
In October 2018, Arizona Governor Doug Ducey announced the creation of a public-private enterprise to pave the way for self-driving vehicles. The state has pledged $1.5 million for the project, the Institute for Automated Mobility, a consortium including Intel, researchers from Arizona State University, University of Arizona, and Northern Arizona University, and state transportation, safety, and commerce agencies. The institute will prepare for the expansion of AV technology in Arizona and nationwide, with a focus on liability, regulatory, and safety implications.
At least three dozen companies besides Intel, Uber, and Waymo are involved in developing or testing AVs, including Audi, BMW, Chrysler, Ford, General Motors, Jaguar, Lyft, Tesla, Volkswagen, and Volvo. While no fully autonomous vehicles are available to consumers yet, the current cost of a personal AV “hardware and software package” would add $70,000 to $200,000 to the base price of a vehicle, according to various estimates; those figures are expected to come down dramatically, to closer to $5,000 to $15,000, as the technology evolves and is adopted more widely.
Planning for the Unplannable
What will this mean for cities? That’s a source of much debate. The “utopian” perspective holds that AVs will usher in a seamless, door-to-door, new-mobility system. Their potential benefits include increased roadway safety—the National Highway Traffic Safety Administration estimates that 94 percent of serious crashes are due to driver error—as well as potential impacts on urban planning and mobility:
On the “dystopian” downside, critics says, tightly spaced and continuously cruising AVs could have negative consequences for bicyclists and pedestrians. If they didn’t have to sit behind the wheel, more commuters might opt for a longer commute to a larger house and yard, expanding sprawl, creating more low-density development, increasing municipalities’ costs for providing public services, and inflating land and housing costs in the outer reaches. If AVs were predominantly privately owned passenger vehicles rather than shared shuttles, they would increase congestion. Negative environmental impacts could be compounded by vehicles that were not renewably powered and by the high level of toxicity in manufacturing and disposal of electric batteries. Privately owned AVs could widen the divide between the transportation haves and have-nots.
Utopian, dystopian, or somewhere in between, one thing is certain: The AV future will require adjustments in the way urban planners think. “Because of the significant anticipated impacts of AVs on public infrastructure, land use, and public finance, it is vital that planners actively prepare now for their widespread arrival on city streets,” says Carbonell.
As to how to do that, “most preparation for autonomous vehicles involves good-sense common planning principles,” says David Rouse, research director for the APA. “Cities should start with visioning and goal setting and look at development codes, street regulations, public investment, capital improvements,” and other areas to guide planning. A key question, he suggests, is how do AVs serve those futures?
“The danger now is that the private sector and car manufacturers will drive how this rolls out,” says Rouse. Cities will need help from new types of collaborations and public-private partnerships, he says. “OEMs also need to be brought to the table with cities and the public sector as we figure out how to introduce this technology.”
Rouse suggests planners create a site plan review checklist for AVs and consider ideas contained in Planning for Autonomous Mobility, a 2018 APA report that aims to provide direction for planners as they update their communities’ long-range plans (Crute 2018).
Nico Larco, an architecture professor and director of the Urbanism Next Center at the University of Oregon who presented at the Planning Directors Institute, says cities need to take control of how AVs are introduced and managed before they just appear on the streets, as happened with electric scooters.
Larco advises several steps to ensure control of new mobilities: First, identify and document city priorities. He pointed to Seattle’s New Mobility Playbook, which identifies outcomes, values, and priorities for equity, economic opportunity, and environmental sustainability (SDOT 2017).
Second, “figure out how best to leverage the new technologies to get to the outcomes you want,” he says. “High-density, mixed-use, built-on-transit are key pieces we need to focus on, and the new mobility gives us that ability. Make sure we frame it as, ‘These are the outcomes we want,’ and use new mobility to achieve that.”
Third, define how data will be collected, who owns it, and how it will be shared. “Data is critical to regulating and evaluating mobilities to see whether they are doing what they said they’d do, and the city is getting the outcomes it wants,” he says.
Parking Requirements
Parking is emerging as a critical issue as cities begin to look in-depth at the on-the-ground challenges of AVs. In 2018, Chandler, Arizona—one of the four Phoenix metro cities piloting Waymo shuttles—became the first U.S. city to change its zoning code in anticipation of AVs. The zoning amendments, which went into effect last June, allow for minimum parking requirements for new developments to be reduced by up to 40 percent in exchange for the inclusion of passenger loading zones for shared AVs. One passenger loading zone could achieve a 10 percent reduction in parking, with a cap at 40 percent, depending on the number of zones, land use, and building square footage. Planning staff had two primary objectives: to allow for more flexibility in parking minimums as demand for parking changes, and to promote the creation of loading zones for shared rather than single-passenger vehicles.
“In the future, if AV usage picks up, we see the need for parking to be reduced drastically, and we need to be flexible now,” says David de la Torre, Chandler planning manager and principal planner for the ordinance project. Reducing parking “presents a lot of opportunity for the city to redesign itself to be a better city for residents and businesses,” he says. De la Torre adds that the zoning change is garnering support: at least five developers of multifamily and commercial mixed-use projects are interested in creating TNC-AV passenger zones.
With an estimated 1 billion to 2 billion parking spaces across the U.S., most cities are significantly overparked, says Larco. Seattle, for example, has about 29 parking spaces per acre, more than five times its residential density of 5.7 households per acre, according to a study of parking in five cities by the Research Institute for Housing America (Scharnhorst 2018). Cities including San Francisco and Hartford, Connecticut, have eliminated minimum parking requirements citywide to help speed up development projects and reduce the number of cars on city streets, and other cities have relaxed parking minimums or removed them in transit corridors.
When the nation shifts to AVs—and most experts agree that the question is indeed when, not if—cities will see “tremendous opportunities because we’ll need less parking,” says Larco. He estimates that, in contrast to cars, which sit idly parked 95 percent of the time, AV shuttles could be in service half-time, depending on their manufacturing and maintenance costs. Others say AV shuttles could run almost continuously except for brief recharging stops. When they’re not chauffeuring riders, AV fleets will still need a place to park at least temporarily—ideally on less expensive land near arterials or freeways with access to a substation to recharge.
AVs also could reduce the cost of urban development. The median cost of building parking in the U.S. is $20,450 per space, according to WGI, a nationwide transportation and civil engineering firm. But that can vary greatly, depending on site factors and regional construction costs. In Denver, underground parking can cost $40,000 per space and aboveground $25,000. In Seattle, structured parking can cost over $100,000 per space. These parking costs, which can amount to 20 percent of a project’s total development costs, could be used to build more affordable housing, public amenities, or to underwrite additional costs for building sustainable buildings. According to the Lincoln Institute’s Carbonell, “One of the greatest potential benefits of the shift away from personal cars could be the freeing up of urban land currently used for parking for redevelopment at greater densities, with more affordable housing and a more livable public realm.”
Goodbye to Garages?
Meanwhile, how do you decide whether to build that new municipal parking garage? Obtaining a parking construction bond now for 30 years could mean losing money. If you still need to build it, how should it differ from the parking garages of past decades?
Some cities and private developers are building parking garages with flexible design that allows for conversion to other uses later, like office space or housing. Global design firm Gensler is helping clients develop buildings with AV-compatible features like the three flexible garage floors in its 84.51° Centre, an eight-story mixed-use office building in Cincinnati. Gensler is designing Giambrocco, a mixed-use project in Denver’s River North (RiNo) district that includes a five-story office building on top of three floors of flexible garage space. Gensler and the Giambrocco developer, Tributary Real Estate, compared the cost of building a standard parking garage with slanted floor plates and ramp parking against a flex design with flat floor plates, 14-foot ceiling heights to accommodate office space, and external speed ramps that can be removed when the space is converted. They determined the flexible garage design would cost 25 percent more for the same 375 parking spaces, a $2.3 million difference on the $80 million project, mostly because of higher construction costs, says Brent Mather, principal and design director for Gensler’s Denver office. The developer determined that it made financial sense to build the flex plan, he says, because “ultimately when the demand for parking is reduced in 10 to 15 years, converting it to office space will provide bigger returns on investment.”
Cities have compelling reasons to build flexible municipal parking garages “because they’re long-term holders of the properties and have public money invested,” says Mather. For maximum adaptability in buildings, he advises, cities should develop only above-ground flexible parking, as underground parking has limited reuse potential beyond concepts such as data centers, gyms, and drop-off areas for buildings serving thousands of people. Airports will have to determine what to do with their massive and revenue-rich parking areas and how to provide more efficient drop-off and pick-up areas, he says, “as part of this paradigm shift.”
“We’re at peak parking in the next year or two,” says Dixon. “Any project that is being planned and permitted today should demonstrate it can increase density for the kinds of projects that will be at the forefront of the AV shift—new urban districts and large mixed-use developments. Any parking we build or that exists today should be able to support 50 to 100 percent more development in 10 years. That’s an unprecedented opportunity to double our density in urban cores.”
Dixon and other AV advocates advise that urban planners and municipalities should look at every possible alternative to building structured parking and consider surface parking only as a placeholder for a site. They also suggest requiring district parking for large development areas and shared parking for mixed-use residential development to reduce by a third the number of parking spaces needed by residents and office/retail spaces.
Rethinking Roads
“The million-dollar question is, ‘What’s the minimum we have to do to redesign streets?’” says Larco. “None of us are building for this new technology, and most of us want to make as few changes as possible.”
AVs will require rethinking roadway and street design for elements such as separation of lanes by speed, lane width, and prioritization, locating pick-up/drop off zones, and paying more attention to how buildings meet sidewalks and streets. During the transition to a fully automated AV fleet, narrower lanes could be designated and striped like HOV lanes are now. But as AVs are adopted more widely, roadways might be designed with narrower lanes, which would leave more public-realm space for active streetscapes, pedestrian and bike infrastructure, open space, and green infrastructure.
Harvard GSD’s Future of Streets project, led by Andres Sevtsuk, created 24 scenarios for how cities might adapt streets to emerging transportation technology—ride-hailing, as well as electric and autonomous vehicles—in ways that ideally would maximize multimodal, socially inclusive, and environmentally sustainable outcomes. The research project is partnering with the Los Angeles and Boston planning and transportation departments. At key intersections in each city, Sevtsuk explained at the Planning Directors Institute last fall, his team assessed the current scenario, then outlined “heaven” and “hell” alternatives.
At LA’s busy downtown Vermont/Santa Monica intersection, site of a Red Line rail station, the team’s “heaven” scenario for shared electric AVs included improved public transport systems, shared AV pick-up and drop-off zones, continuous bike lanes, active retail facades, and street trees and landscaping. The potential “hell” scenario for the same intersection included an AV-exclusive freeway prone to being blocked by disabled vehicles, an elevated highway for private AVs, drive-indoors restaurants, and railings and barriers that prevented pedestrian crossings. More than two-thirds of the AV scenarios created as part of the project’s research pointed to more congestion, says Sevtsuk.
Sevtsuk advises cities to begin making urban design and infrastructure changes that can help manage TNCs and the transition to AVs, beginning with passenger pickup and drop-off areas. “Hong Kong and Singapore, very dense cities, have highly regulated pick up/drop off zones on every city block,” he says, adding that the lack of such zones in U.S. cities is causing major traffic and public safety issues. The Future of Streets project is also exploring the use of HOV lanes for multi-passenger AVs, as well as for bus rapid transit, as an incentive for using shared mobility, promoting the idea that “if you share your rides, you’ll get through cities much faster,” says Sevtsuk.
In some cities, these changes are starting to appear. Las Vegas is working on a change to its zoning code to allow for downtown ride-share lots that would eventually also serve as AV passenger zones, says Summerfield. Local companies Lyft and Zappos partnered on creating a downtown art park and pick-up/drop-off area on a privately owned parking lot. The city approved the pilot last year as a special-event project, a one-off to prove the concept could work. The city then entitled the project through the normal process as a plaza/parking facility, and is trying to replicate it with other private landowners and city properties as a public amenity that can help reduce traffic congestion.
Preparing for Change
The shifts caused by AVs will affect municipal budgets. In fiscal year 2016, the 25 largest U.S cities netted nearly $5 billion from parking-related activities, camera and traffic citations, gas taxes, towing, and vehicle registration and licensing fees (Governing 2017). But gas tax revenues will shrink if AVs are electric. There could be fewer vehicle registration fees as car ownership dwindles. Parking tickets could become a thing of the past. The list goes on.
“The change will be stepped, and not gradual,” says Larco. He advises cities to consider VMT fees, congestion pricing, and new municipal revenue generators, such as taxes or fees for empty seats, charging stations, use of curb access, fleet parking, GPS, data, advertisements, and mobile business and retail, as well as tax credits for vehicles full of passengers.
So far, cities have approached companies like Uber and Lyft with mostly “stick” dissuaders of fees and taxes for their impacts, notes Sevtsuk. Some U.S. cities are considering a congestion toll, such as those levied in European cities like Stockholm. But congestion charges are hard to implement, he says, and have to be approved at the state level. He says a combination of carrots and sticks, with more progressive ways to welcome new technology on the streets, is more likely to gain public approval.
As the AV industry gains speed, cities also will have to factor in many other considerations—ranging from the location of electric charging stations to the redesign of traffic signals, from redevelopment opportunities to workforce impacts—and they don’t have much time to do it.
By some estimations, 2030 will be the tipping point for tech companies and OEMs to produce AVs exclusively and for the public to adopt AVs on a massive scale, with the potential for a completely autonomous fleet by 2050. Some states are already preparing for an AV future: The Colorado Department of Transportation is planning for communications between vehicles and the highway along the I-70 corridor that traverses the state from east to west through the Rocky Mountains.
But AVs also might not dominate the landscape as soon as some tech companies and OEMs hope. In the United States, 50 percent of respondents to a survey conducted by Deloitte did not believe AVs will be safe, and 56 percent were not interested in ridesharing services. Nearly two-thirds of respondents were concerned about biometric data being captured via a connected vehicle and shared with external parties (Deloitte 2019).
Regardless of how quickly AVs will be adopted, says Larco, “they will have impacts on all sorts of things in cities, and we need to prepare.” He advises urban planners, municipal officials, economic development directors, environment and equity advocates, and others to be proactive about making policy and infrastructure changes. Cities historically have had trouble with change, he says, and the pace of change is much faster now. When it comes to evolving mobility options, he adds, cities will need to “be nimble in their approach, create responsive regulations, and change the culture of risk with stakeholders and constituents by letting them know, ‘We’re going to try things out.’”
New Mobility Options and Equity
In cities and suburbs alike, many people who are elderly or disabled, who live too far from public transit stations, or who can’t afford transit fare are left without convenient mobility options. How do cities equitably share the benefits of new mobility options for all their residents?
Some cities are making it a priority. In Washington, DC, Ford is piloting a citywide AV project in both wealthy and low-income neighborhoods. The city’s Interagency AV Working Group, composed of transportation, disability rights, environmental, and public safety officials, is focused on ensuring AVs will benefit all eight wards of the city. Last October, Ford Autonomous Vehicles announced a job training program in conjunction with the AV project, in partnership with the DC Infrastructure Academy and Argo AI, an artificial intelligence company.
In other cities, AVs are playing a role in on-demand transit programs. In what may be the first-of-its-kind partnership between an AV tech company and a public transit system outside of a controlled environment, Waymo and the Phoenix area’s Valley Metro Regional Public Transportation Authority (Valley Metro) have been using Waymo’s self-driving vehicles as robotaxis to help fill some mobility gaps across the metro area.
“Think of it as the start of mobility on demand or mobility as a service,” says Scott Smith, CEO of Valley Metro, which provides regional bus service and a 26-mile light-rail system slated to expand to 66 miles by 2034. Bloomberg reports the first wave of paying Waymo customers likely will draw from the early rider program for trips such as first and last-mile transportation to transit stations, but the partnership also holds promise for addressing transportation inequities.
In California, a $12 million pilot program launched last fall by the City of Sacramento and Sacramento Regional Transit has expanded low-cost rides in electric shuttles to connect people in the lower-income neighborhoods of disinvested South Sacramento with jobs and services as part of a larger effort to provide greater social and economic equity around transit. The shuttles cost less than ride-hailing services, and rides are free for groups of five or more. So far the electric vehicles are not AVs, but in a city that prides itself on being, in the words of Mayor Darrell Steinberg, “a center of innovation in new transportation technologies,” that could soon change.
Kathleen McCormick, principal of Fountainhead Communications, LLC, lives and works in Boulder, Colorado, and writes frequently about sustainable, healthy, and resilient communities.
Photograph: A driverless shuttle at the University of Michigan in Ann Arbor, where researchers are studying consumer acceptance of autonomous vehicles. Credit: Levi Hutmacher, University of Michigan.
References
Arity. 2018. “Be Patient, a Change Is Gonna Come.” November 8. https://www.arity.com/move/patient-change-gonna-come/.
Bloomberg Philanthropies and The Aspen Institute. 2017. “Taming the Autonomous Vehicle: A Primer for Cities.” Long Island City, NY: Bloomberg Philanthropies and The Aspen Institute (March). https://www.bbhub.io/dotorg/sites/2/2017/05/TamingtheAutonomousVehicleSpreadsPDF.pdf.
Bragg, Dave and Stephen Pazzano. 2017. “The Transportation Revolution: The Impact of Ride-Hailing and Driverless Vehicles on Real Estate.” Washington, D.C.: Urban Land Institute and Green Street Advisors (October). http://s3-us-west-2.amazonaws.com/gstqa-us-west/uploads/2017/10/19153037/ULI-Green-Street-Fall-17-Presentation.pdf.
City of Austin and Capital Metropolitan Transportation Authority Board. 2017. “Smart Mobility Roadmap.” Austin, TX: City of Austin and METRO (October). http://austintexas.gov/sites/default/files/files/Smart_Mobility_Roadmap_-_Final.pdf.
Crute, Jeremy, William Riggs, AICP, Timothy Chapin, and Lindsay Stevens, AICP. 2018. “Planning for Autonomous Mobility.” Chicago, IL: American Planning Association (September). https://www.planning.org/publications/report/9157605/.
Deloitte. 2019. “Global Automotive Consumer Study: Advanced Vehicle Technologies and Multimodal Transportation.” https://www2.deloitte.com/us/en/pages/manufacturing/articles/automotive-trends-millennials-consumer-study.html#.
Governing. 2017. “Special Report: How Autonomous Vehicles Could Constrain City Budgets.” Washington, D.C.: Governing (July). https://www.governing.com/gov-data/gov-how-autonomous-vehicles-could-effect-city-budgets.html#data.
Harvard University Graduate School of Design. “Future of Streets.” https://www.gsd.harvard.edu/project/future-of-streets/
Perkins, Lucy, Nicole Dupuis, and Brooks Rainwater. 2018. “Autonomous Vehicle Pilots Across America.” Washington, D.C.: National League of Cities. https://www.nlc.org/sites/default/files/2018-10/AV%20MAG%20Web.pdf.
Scharnhorst, Eric and Research Institute for Housing America. 2018. “Quantified Parking: Comprehensive Parking Inventories for Five U.S. Cities.” Washington, D.C.: Mortgage Bankers Association (May). https://www.mba.org/Documents/18806_Research_RIHA_Parking_Report%20(1).pdf.
SDOT (Seattle Department of Transportation). 2017. “New Mobility Playbook.” Seattle, WA. September. https://www.seattle.gov/Documents/Departments/SDOT/NewMobilityProgram/NewMobility_Playbook_9.2017.pdf.
Shared Mobility Principles for Livable Cities. https://www.sharedmobilityprinciples.org/.
University of Oregon. “Urbanism Next Center.” https://urbanismnext.uoregon.edu/

“What gets measured, gets managed,” goes the business truism. The idea applies to the design of cities and infrastructure, too. And the emergence of big data—massive sets of raw information made possible by new collection and storage technologies—is making possible new measurements that can inform how state transportation agencies plan and manage their projects.
Consider the work being done by the State Smart Transportation Initiative. Founded in 2010 at the University of Wisconsin, SSTI uses new data troves to guide real-world land use and planning decisions. By combining and analyzing data on questions ranging from how people access transit stations to how easy it is for them to get to work or the grocery store, SSTI is shedding light on patterns that can inform future decision making.
In 2018, SSTI began operating in partnership with the nonprofit Smart Growth America (SGA), whose programs include serving as a resource for state departments of transportation. SGA had collaborated with SSTI on multiple editions of The Innovative DOT: A Handbook of Policy and Practice, a guide for “for DOTs committed to innovative excellence.” The partnership now works with more than a dozen transportation agencies, functioning as a kind of policy knowledge base and providing direct technical assistance.
One key to making the most of big data is finding the right framing. “Accessibility means looking at ‘how accessible is this place?’ as opposed to ‘how fast are the cars going on a certain part of road?,’” explains SSTI Director Eric Sundquist. This more holistic approach is not a new idea, but it’s one that’s gaining momentum, partly because of richer data and more sophisticated tools for sorting it. In recent research, SSTI defined accessibility as “the ease with which people may reach opportunities such as jobs, stores, parks, schools, and other destinations. ‘Ease’ is measured in terms of travel time, with some adjustments to account for how travelers use the system.”
Among other projects, SSTI has been working with the Virginia Department of Transportation, whose Smart Scale program draws on a range of big data to “score” transportation proposals submitted by counties and municipalities on their likely ability to improve accessibility to jobs. The most recent round also incorporates access to non-work destinations such as shopping and parks.
As an example, an SSTI planning exercise focused on improving non-work-destination access in Vienna, Virginia. One track of analysis explored how beefing up a walking network and bike path could better connect the town’s main street to other neighborhoods. But another track considered a scenario that involved a shift in land use: encouraging the commercial development of an underused area on the southern edge of town. The latter actually led to higher-scoring accessibility improvements than the hypothetical transportation projects.
This scoring scheme draws on population, employment, and land use data; auto data; transit service data that’s now largely reported in a consistent format thanks to Google Maps; and bike and pedestrian data. Depending on the project, more data can be added, like job categories and neighborhood income. This opens up broader thinking about how “accessibility” can be improved, measuring whether the best option is building new pedestrian infrastructure or working to place a grocery store in a food desert.
“We’ve made people aware of this in our community of practice,” Sundquist adds, so that other DOTs can build on the same ideas. And indeed, transportation officials from Hawaii recently worked with SSTI to try to take the scoring process “a step further,” he continues. “We scored all their projects on a weighted accessibility basis. So if a project provides more access by transit in relation to auto, it will suggest how modes might shift.” The state is evaluating SSTI’s results now.
Such data represent both improvements on existing information-gathering methods and measurements that are altogether new, observes Amy Cotter, associate director of Urban Programs at the Lincoln Institute.
For example, she says, planning decisions have often relied heavily on transit survey results, which are “expensive to collect and sometimes questionable.” So the emergent technologies SSTI is harnessing—including “trip-making data” culled from services that aggregate information from GPS-enabled vehicles, navigation devices, and even smartphone apps—are an enticing alternative. “These new data are providing better information at lower cost to prepare agencies, planners, and state DOTs to make better decisions,” Cotter says.
The Lincoln Institute partnered with SSTI in a 2017 project, “Connecting Sacramento,” along with a variety of public and private entities and stakeholders. The resulting study, which catalyzed much of SSTI’s more recent work, sought to assess how these new data sources, and new tools for understanding data, could help improve transportation policy.
The Sacramento research included a case study on walking trips to and from a particular transit station. SSTI worked with traffic analytics startup StreetLight Data, which has devised methods for assessing GPS signals with machine learning to distinguish walking and biking behaviors. Walking and biking have at times “gotten short shrift” in planning efforts, says Sundquist, precisely “because they’re so hard to measure.” So adding this new information to other transportation and land use data sets can lead to new discoveries. In this case, the data pointed out an unexpectedly high percentage of foot trips between the transit station and a particular cluster of office buildings. This was surprising, given that the buildings not only had ample parking, but also were accessible on foot only by way of a single route—across a freeway. The study argued that, in light of this finding, improved or additional access points would improve conditions for current commuters and encourage more to join in.
Such analysis, of course, can often be miles ahead of the realities facing a state department of transportation. But programs like Virginia’s Smart Scale rating system suggest what big data analysis might lead to. Continuing advances in data collection and analysis should mean we will be better able to evaluate the impact of any given project, and better able to compare that to what was predicted—and adjust for the future.
The “what gets measured gets managed” cliché is sometimes used, inappropriately, to argue that what isn’t (or can’t be) measured also can’t—or even needn’t—be managed. But as Sundquist argues, these new forms of transportation data and analysis can be considered as an opportunity. They can reveal practical, actionable information. And they can also help planners, transportation managers, and others think creatively about what they wish they could measure next.
Rob Walker is a journalist covering design, technology, and other subjects. His book The Art of Noticing will be published in May 2019.
Image: Mapping and data analysis by the State Smart Transportation Initiative can help transportation officials make more informed decisions. This map shows transit patterns in the Sacramento area. Credit: State Smart Transportation Initiative
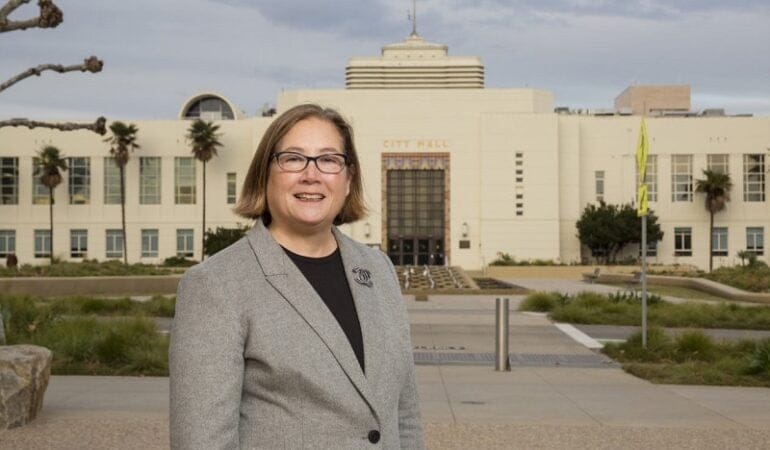
For some people, Santa Monica conjures images of sunshine and surfing. But the southern California city should rightly be known for sustainability, too. The City Council adopted the Santa Monica Sustainable City Program in 1994; twenty-five years later, the city has made measurable progress on projects ranging from retrofitting buildings to embracing renewable energy. The council selects a new mayor every one to two years, ensuring fresh perspectives at the helm. Most recently, Gleam Davis was sworn in as mayor in December 2018, after serving on the City Council since 2009. Active in the community since moving there in 1986, she has been involved with the Santa Monica Planning Commission, Santa Monicans for Renters’ Rights, the Board of Directors of WISE Senior Services, and the Santa Monica Child Care and Early Education Task Force, among many other organizations. As corporate counsel for AT&T, she has worked with KIND (Kids in Need of Defense), which represents unaccompanied minors in immigration courts. Before joining AT&T, Davis prosecuted civil rights violations as a trial attorney in the Civil Rights Division of the U.S. Department of Justice, and was a partner at the law firm of Mitchell, Silberberg & Knupp. A native of California, she holds degrees from Harvard Law School and USC. Davis and her husband, John Prindle, have one son, Jackson. She spoke with Lincoln Institute Senior Fellow Anthony Flint about Santa Monica’s sustainability efforts, which have been heralded by OECD’s Champion Mayors, for this issue of Land Lines.
Anthony Flint: Does Santa Monica’s system of having a mayor for two years present a challenge for sustainability efforts, which often are slow to get going—and to pay off? What are the projects that can have the greatest impact through your upcoming term?
Gleam Davis: I don’t think it creates much of an impediment to the sustainability agenda. The mayor and the mayor pro tem are members of the entire city council. The city council sets the policy, adopts the budget, and drives the city’s policies. Then it’s the city manager who does the implementation. Whatever policy direction is given to the city manager is from a vote of the full city council.
On the sustainability front, the big news is we are now part of a group called the Clean Power Alliance, where the default provision for customers is power that is 100 percent sourced from renewables. This is helping us take a big leap toward energy self-sufficiency. People can choose to shift into lower tiers, such as 50 percent renewable, or they can opt out entirely. There are also discount options for low-income families. So far the opt-out rate is very low.
Another continuing thread is providing mobility choices. We live in a compact city, less than nine square miles, and we have the ability to provide transport options to our residents. We have light rail with three stations, so you can take transit to downtown Santa Monica or downtown LA. For our Big Blue Bus, [which runs on natural gas and is moving toward an all-electric fleet by 2030], we have a policy of ‘any ride, any time,’ so students can get on a bus, show an ID card from any college—a lot of UCLA students ride those lines, and of course [students from] Santa Monica College—and it’s free.
AF: The city’s overall greening strategy has included a first-of-its-kind zero net energy ordinance for new single-family construction and a commitment that all municipal power needs be met by renewables. But the new $75 million municipal building project has been criticized as too expensive. How can being green be cost-effective?
GD: What’s important to know is, we’re leasing a fair amount of private property for government offices, at a cost of roughly $10 million a year. We needed to bring employees into a central location, which will save money on leases, and will encourage face-to-face and ‘accidental’ meetings that can be so important to communication. It just made business sense to have everybody under one roof. We’ll end up saving money over time, and ultimately the building will pay for itself just on that basis. There will be additional savings over time if the building is energy neutral and has reduced water intake—we won’t be consuming resources outside the building.
One of the things we’ve done is require developers to meet pretty stringent sustainability requirements. If we’re going to do that, we need to walk the walk. That’s one of the things this building shows—it’s possible to build an aggressively sustainable building that will ultimately bring savings. We’re trying to be a model, to show that with a little up-front investment, you can have a big impact over time.
AF: How does the Wellbeing Project, which won an award from Bloomberg Philanthropies for its ongoing assessment of constituents’ needs, connect to your sustainability efforts? What has it revealed?
GD: We declared ourselves a sustainable city of well-being. How are the people in the community faring—are they thriving, or are there issues? The Wellbeing Project began as an assessment of youth and how they were doing, and what can we as a city do, to try to help. It’s really about changing the relationship between local government and people. It’s not really a new concept—it goes back, not to be corny, to the Declaration of Independence: life, liberty, and the pursuit of happiness. That doesn’t mean people going out and having a good time, but the ability of people to thrive. A sense of community can get frayed, whether due to technology or culture. One of the things we do is make sure children enter kindergarten ready to learn. For our older citizens, are they feeling isolated in their apartments? It’s a global movement we’re thrilled to be a part of.
In our Wellbeing Microgrant program, if people come up with something to build community, we will fund it, up to $500. One example was going out and writing down the histories and memories of Spanish-speaking residents in the many parts of the community where English is a second language. Another was a dinner to bring together our Ethiopian and Latino communities. One individual took a vacant lot and created a pop-up play area and space for art. It’s about community connectedness.
AF: Another innovative strategy is to impose charges on excess water use to fund energy-efficiency programs in low-income homes. In terms of water, what’s your long-term view on managing that resource in what looks to be perilous times ahead?
GD: The other thing we’ve done, which will percolate throughout my term and next, is to work on becoming water self-sufficient. We control a number of wells in the region, but we had contamination in the 1990s, and ultimately reached a multi-million-dollar settlement [with the oil companies responsible]. We had been getting 80 percent of our water from the Metropolitan Water District [after the contamination was discovered]—if you saw Chinatown, that’s [the system that] sucks water out of the Colorado River and brings it to LA—and now we’ve totally flipped that, and we’re getting 80 percent of our water from our own (restored) wells again. This makes us more resilient in case of an earthquake affecting the aqueducts or other disruptive events to water infrastructure, like broken water mains. Pumping water over mountains [from the Colorado River] also takes a lot of energy. We are making sure our water infrastructure is sound. We’re not trying to isolate ourselves. But by getting water from our own wells, we will have good clean water for the foreseeable future.
AF: What policies would you like to see that might limit the devastation so sadly seen in the recent wildfires in California?
GD: Luckily Santa Monica was not directly affected by the Woolsey Fire. Our neighbor Malibu was—their emergency operations center was right in the path of the fire, so they came and used ours, for fighting the fire, rescuing people, and cleaning up. We had Santa Monica firefighters on the ground throughout the state under mutual aid. We hosted meetings with FEMA on displacement and recovery. We have a chief resiliency officer, and she is a steady drumbeat, reminding people [that a major natural disaster] could happen here. We have promoted the Seven Days Plan—does everyone have seven days of water, food, and an emergency radio that doesn’t require electricity? We also passed aggressive earthquake requirements, evaluated properties that are most vulnerable, and are now moving to seismically retrofit them.
These things we do in Santa Monica may seem a little aggressive, and cost money, but it’s not just about winning awards or patting ourselves on the back for being environmentally progressive, it’s so that we’ll be able to weather things like fires. People say you’re spending money, raising water rates, and it costs more for energy. . . . We want to do it to address the impacts of climate change. But it also means that when there’s a natural disaster, we are more resilient.
AF: The city’s experience with electric scooters—I’m referring to the company that deployed a fleet without asking permission—seemed to show that the transition to a sharing economy coupled with technological innovation can be messy. Is it possible to welcome disruption and maintain order?
GD: We were sort of ground zero for scooters. It was disruptive at first, and we had to make a lot of adjustments. Their philosophy was that it was easier to ask forgiveness than permission. There was some panic, and some people were also using them in a horrible manner. Now we’re in a 16-month pilot program, where we selected four dockless mobility operators: Bird, Lime, Jump, which is part of Uber, and Lyft. We created a dynamic cap on the number of devices on the street, so they can’t put out as many as they want. We have some policies to address conflicts and safety, and we have issued tickets when necessary.
This is all part of giving our residents lots of mobility options. It’s all designed to give people the option to get out of their car, whether it’s going to downtown LA or walking two blocks to a neighborhood restaurant. We wanted to make sure our more economically diverse communities had access, so it’s not just downtown. If you can replace a car with alternative means that include scooters or electric bikes for that first or last mile, that’s a big cost savings. We had about 150,000 rides on shared mobility [in November 2018]. That’s pretty amazing for a place with 93,000 people. At the end of the pilot, we’ll evaluate everything and figure out where we go from there.
A number of neighboring cities banned scooters outright, but that’s not how Santa Monica deals with technology. We’re figuring out the best way to manage the disruptive technology. Disruption isn’t a four-letter word.
Photograph: Kristina Sado

Nineteen years after it began, a record-setting drought is still choking the Colorado River Basin. The so-called “Millennium Drought” is now recognized as the worst of the past century.
On the rocky walls that hem in Hoover Dam and Lake Mead behind it, the deepening drought can be plainly seen in scaly white “bathtub” rings left behind by the falling water levels. Amazingly, thanks to the river’s massive reservoir system, no one has been forced to go without water—yet. But officials throughout seven U.S. states and Mexico now obsessively monitor mountain snowpack estimates each winter in the hope that the coming year might bring relief.
The drought has haunted water managers not only because it has lasted so long, but also because “things turned really bad really fast—much faster than we thought,” says Jeff Kightlinger, head of the Metropolitan Water District of Southern California, which supplies water to 19 million people in Los Angeles, San Diego, and surrounding areas.
The drought has also brought a series of hard reckonings about the future, and spurred a tremendous amount of soul-searching among those who manage and rely on this river. The unprecedented conditions, along with increasingly available science about the looming impacts of climate change, have forced water managers to contemplate scenarios far outside what they’re comfortable with, and to radically rethink some of their most basic assumptions about the river—beginning with how much water it can actually provide.
Over the past decade and a half, water managers have been in near-perpetual negotiations with each other over how to deal with the drought. The tempo of that process has been relentless, and has, at times, had a distinctly Sisyphean air: Negotiators have been working overtime to stay ahead of the problem, yet the drought presses on.
But something remarkable is happening. The drought has helped bring people together on what has been a famously contentious river. And the so-called “Law of the River”—an accretion of agreements, treaties, acts of Congress, and court rulings often criticized as hopelessly inflexible—may be evolving to meet the hard realities of the twenty-first century.
Throughout much of last year, water managers in the upper and lower Colorado River basins pushed hard to finalize a pair of “drought contingency plans,” referred to collectively as the DCP. They are the biggest and most ambitious effort yet to come to terms with the problems on the river. And yet the DCP will ultimately be just a starting point.
“The DCP, in my mind, is like a tourniquet,” says Kightlinger—an emergency measure to stanch traumatic fluid loss and stave off shock. “We really need to start pulling together a summit of the states, and say, ‘OK, that’s bought us a decade or so—but now we need our 50-year plan. So let’s get to work.’”
Dealing with Drought
Like most of us, Colorado River water managers tend to keep a pretty close eye on their gauges. And the single most important indicator on the river is, for a variety of complicated reasons, the water level in Lake Mead, just outside of Las Vegas.
Although it’s not necessarily intuitive for laypeople, the water level’s elevation above sea level is a proxy for the amount of water in the reservoir. Lake Mead is full when the water level is at roughly 1,220 feet above sea level. “Empty”—or what managers ominously refer to as “dead pool”—lies somewhere around 895 feet.
In 2003, after the severity of the Millennium Drought started becoming apparent, representatives of the seven states that depend on the Colorado—Arizona, California, Colorado, Nevada, New Mexico, Utah, and Wyoming—began meeting to negotiate a plan for softening the blow. Their focus was on holding the water level in Lake Mead at 1,075 feet, or roughly 35 percent of capacity, a level that water managers simply refer to as “ten-seventy-five.” If the level dipped down even more, to about 1,025 feet, the U.S. Secretary of the Interior would likely declare a shortage. Avoiding that declaration is important to the states, because if a shortage is declared and the states can’t agree how to handle it, the federal government has the authority to take over management of the river.
At press time, Bureau of Reclamation Commissioner Brenda Burman announced a January 31, 2019 deadline for the states to complete their drought contingency plans. Speaking at the annual Colorado River Water Users Association convention, Burman spelled out the consequences of failing to meet this deadline: the federal government will step in to impose cuts in water deliveries. Five of the basin states have approved their plans; Arizona and California announced they are close and expect to finish before the deadline. “‘Close’ isn’t done,” Burman said. “Only ‘done’ will protect this basin.”
Together, they came up with the so-called 2007 interim shortage guidelines, the first major interstate agreement about how to respond to the drought. Were Lake Mead to fall below ten-seventy-five, Arizona and Nevada (but not, owing to some complicated legal history, California) would cut back their water allocations in three stages, each progressively more drastic.
Taking this step would force the two states to make do with less water in any given year. But it would also slow the decline in Lake Mead and reduce, or at least delay, reaching more severe drought levels.
The plan included several measures intended to keep Lake Mead above ten-seventy-five for as long as possible. That effort has worked—but just barely. Not once since the drought began has Lake Mead sunk below ten-seventy-five. This is in large part because the states and the U.S. Bureau of Reclamation have managed to add an extra 23 feet of water to the lake, primarily due to some irrigation districts and tribes agreeing to cut back on their own water use. But for the past four years, the reservoir has been hovering within feet of 1,075 feet. Meanwhile, scientists have released a succession of increasingly dire projections about the long-term impact that climate change will have on Colorado River water supplies.
To better prepare for worsening conditions, the states’ representatives began meeting again to negotiate a new set of drought contingency plans, one for the Upper Basin and one for the Lower Basin. In October, the states, together with the federal Bureau of Reclamation, finally released the draft agreements, which will essentially beef up and expand the 2007 shortage guidelines.
In the Lower Basin, Arizona, Nevada, and California committed to trying to keep Lake Mead above 1,020 feet through the year 2026. To do that, Arizona would progressively reduce its use of Colorado River water by up to 24 percent, a commitment 50 percent bigger than what the state had made under the 2007 guidelines. Nevada agreed to cuts its uses by up to 10 percent, also a 50 percent larger commitment than under the 2007 guidelines. Notably, California—whose Colorado River entitlement is effectively the most senior on the river, and therefore is exempt from reductions under the Law of the River and the 2007 guidelines—has agreed to reduce its use by up to eight percent in any given year by “banking” water in Lake Mead. In exchange, California, along with the two other Lower Basin states, will have new flexibility to recover and use this “banked” water for use within its borders when necessary; until it uses the banked water, any such supply will help keep the reservoir elevation higher. The idea is to delay and, with hope, reduce the severity of potential shortages.
In the Upper Basin, meanwhile, the drought contingency plan will set up a “drought operations agreement” to buttress water levels in Lake Powell—which lies to the north of Lake Mead and is now a little less than half full—by sending water down from reservoirs higher in the basin when necessary. Significantly, the Upper Basin DCP will also open the door to a “demand management program”—similar to an arrangement that has existed in the Lower Basin since the 2007 guidelines—that would allow state or municipal water agencies to pay farmers to temporarily cut back on water use in order to put more water in Lake Powell. The DCP also includes a program to augment river flows through cloud seeding—a technology that can increase precipitation levels and has proven popular in the West—and the eradication of water-thirsty plants like tamarisk.
In the course of these complex negotiations, Mexico pledged that if the seven U.S. states could agree on the DCP, it would reduce its use of Colorado River water by up to eight percent. All told, the twin DCPs will be a major step forward. Yet many observers—and water managers themselves—say they still won’t resolve the biggest problem that’s been haunting the river for decades.
As Doug Kenney, director of the University of Colorado’s Western Water Policy program, puts it: “We’re just using too much water.”
Facing Facts
It’s never been a secret that there wouldn’t be enough water in the river to meet the obligations hammered out among U.S. states, tribes, and Mexico during the twentieth century, and that there would eventually be some hard choices to make. The closest anyone ever got to tackling the issue head-on was in the 1960s, during congressional debates about whether to approve the Central Arizona Project—a massive, 336-mile canal system that diverts water into the southern and central parts of the state—when it became clear that in the future, there would not always be enough water to keep the project’s canals full. But Congress essentially punted, authorizing studies to evaluate ambitious plans to “augment” the flow of the Colorado River through a number of approaches. Those included cloud seeding, desalination of both ocean water and saline groundwater, and “importing” water from other rivers—including an early attempt to target the Columbia River, more than 800 miles away in the Pacific Northwest, an idea that was swiftly beaten back by the Washington congressional delegation.
For the next several decades, the issue went forgotten, for the simple reason that no one needed augmentation. But the conversation has begun to come full circle as demand has grown, the basin has been in a drought cycle, and climate change has diminished supplies. “Inventing augmentation,” says Eric Kuhn, who for decades led the Colorado River Water Conservancy District in western Colorado, “was a way of putting off the pain into the future, and the future is here.”
The first hints that the problem was no longer a purely theoretical possibility came in the mid-1990s, when California, Nevada, and Arizona began running up against the limits of their Colorado River entitlements. The Upper Basin states began worriedly asserting that there was not enough water left for them to ever receive their full entitlements under the Colorado River Compact.
Then came the drought, which transformed these pinch points into actual pain. On top of the drought and usage issues, there’s some basic math making things even more challenging: Each year, massive amounts of water—some 600,000 acre-feet, enough water for nearly half a million people—simply evaporate from Lake Mead. The traditional accounting system under the Law of the River failed to budget for the water lost to evaporation. In addition, Mexico’s share of the river water is simply “deducted” from the shared supply in Lake Mead, rather than being divvied up among the states. Together, evaporation and the Mexico delivery draw roughly 1.2 million acre-feet more water from Lake Mead each year than is released from Lake Powell, upstream—even without a drought.
Under the 2007 shortage guidelines, the Lower Basin states can receive extra water—so-called equalization releases—if river conditions are good enough. But “in most years, we’re still going to have a deficit at Mead of a million or more acre-feet,” says Terry Fulp, the federal Bureau of Reclamation’s Lower Colorado regional director.
That imbalance has come to be known as “the structural deficit,” and it lies at the heart of the Colorado River’s problems. “It’s a code word, in my mind, for overallocation,” says Fulp. “We’ve got an absolutely overallocated system.”
Untangling this problem will be key to long-term sustainability on the river. It will also be a tremendous challenge—and tremendously expensive. The 23 feet of water the states have managed to add to the water level in Lake Mead since the DCP negotiations began has cost at least $150 million.
That slug of extra water is “important when you’re right at the threshold,” says Kenney of the University of Colorado. But in the bigger picture, he says, “it’s a terribly small amount of water, and it’s a terribly big price tag.” Truly stabilizing the system will require much bolder action, and will cost far more.
Beyond DCP
So what might efforts beyond DCP actually look like?
“You’ve got to be focused on reducing the absolute load on the system,” says Peter Culp, an Arizona attorney who advises both the City of Phoenix and several environmental nongovernmental organizations. But because of wild swings in natural variability like the current drought, he says, “you also need to be prepared to deal with high levels of instability.”
As the states begin to look at longer-term solutions, several broad possible components seem likely to come to the fore:
Augmentation
Today, the term has a far more modest connotation than it did in the 1960s, when vast water-importation plans and massive nuclear-powered desalination plants seemed within the realm of feasibility. Conventionally powered desalination of seawater is now the augmentation option cited most frequently, although the sole operating example is the Poseidon desalination plant that serves San Diego. It produces a relatively modest 56,000 acre-feet per year at a cost double that of water supplied from the Colorado River (Hiltzik 2017). Cloud seeding—artificially induced rainfall—has been carried out for decades, but has only limited effectiveness.
“Augmentation is part of the portfolio,” says Chuck Cullom, the Central Arizona Project’s Colorado River programs manager, “but there aren’t, and have never been, any silver bullet answers.” Augmentation projects, he says, “are all going to be hard-fought, challenging, modest-sized—and more expensive than we thought.”
Markets, Leasing, and Transfers
The ability to move water between water-rights holders will play a huge role in increasing the flexibility needed to weather the looming problems on the river. Although there are still gains to be made in urban water-use efficiency (think reduced water use for grass and landscaping), the water needs of the West’s 40 million, primarily urban, individual water users are relatively inelastic. A discussion is slowly taking shape about ways in which cities can make deals to acquire water from both native tribes and farms in a way that doesn’t threaten the survival of any of those three sectors.
Tribal Rights
Local tribes will likely play a bigger role in meeting future demands, particularly in Arizona, where their right to significant amounts of water has recently been affirmed. “The tribes are increasingly important political players, and they are increasingly important in this idea of leasing and flexibility within the existing rules,” says Dave White, who heads Arizona State University’s Decision Center for a Desert City, which is largely focused on finding ways to help policy makers make better decisions about uncertain futures. “That makes them an important lynchpin in moving from the current allocation system to the future one.” Tribes have rights to an estimated 2.4 million acre-feet of Colorado River water (Pitzer 2017).
Daryl Vigil is the water administrator for the Jicarilla Apache Nation in New Mexico and is head of the Ten Tribes Partnership, which has long pushed for the ability to lease its members’ water to other users. Vigil says that in an era of drought and climate change, tribal water can help cities and other users stabilize their water-supply portfolios while securing much-needed revenue. “Right now, there are tribes that, because of infrastructure issues or policy issues, aren’t able to develop their water rights, so it’s just going downstream” and being used by non-tribal entities without compensation, Vigil says. “To a large degree, we’re already the solution to a lot of these issues, but we’re not getting any kind of credit for it.”
Some tribes have already been able to parlay their water rights into revenue. The Jicarilla Apache tribe, for example, leases water to the federal Bureau of Reclamation to provide minimum river flows for endangered fish, and in 2017 the Gila River Indian Community in Arizona struck a deal with the Bureau, the City of Phoenix, and the Walton Family Foundation to lease its water in order to boost levels in Lake Mead.
Agriculture
Farms will also play a big role in a more comprehensive solution on the river. Agriculture accounts for around 75 percent of water use in the basin, the vast majority of which is used to grow forage and pasture, like alfalfa, for beef and dairy cattle. Farm water supplies could potentially be used for farm-to-city water transfers, or to help cushion the impact of temporary shortages on cities.
In fact, the framework for agricultural-to-urban water transfers on the Colorado River was first created in the late 1990s. The years since have seen a series of test runs and a slow expansion of the concept throughout the Lower Basin and even across the border to Mexico. The terms of the 2007 interim shortage guidelines allow irrigation districts in Arizona, California, and Nevada to “forbear”—that is, to forgo the use of a portion of their water allocation for a year, thereby freeing up water to be stored in Lake Mead for drought protection. The proposed Demand Management Program included in the Upper Basin drought contingency plan would open the door to a similar framework there.
Water for such programs can be generated in a variety of different ways: simply by fallowing farmland (i.e., taking it out of production), thereby freeing up the water that otherwise would have been used to grow crops there; by switching to crops that consume less water; or by improving irrigation efficiency and transferring the conserved water. Although transferring water away from farms is, in the public imagination, often equated with drying up farms and putting them out of business, there is a long history of innovative thinking about how farms can generate water for uses elsewhere while remaining financially viable. In California, for instance, the Palo Verde Irrigation District has been the focus of a long-running “rotational fallowing” program to generate water for the Metropolitan Water District, under which at most 29 percent of the irrigation district’s farmland is fallowed in any given year.
The transfer of water from farms to cities, either temporarily or permanently, is an extremely controversial issue. Any discussion of the topic—especially in Arizona, where farmers would be the first to have their water cut due to contractual agreements made well before the current negotiations began—quickly moves from technical talk of crop consumptive water-use coefficients to basic questions of social equity.
“That’s the crux of the problem: Do people perceive that the pain is distributed fairly?” says Cullom. The drought and the contingency-planning process, he says, are forcing people to come to terms with “the visceral understanding of what a future with less water looks like.”
Win, Lose, or Draw
Back in the early 1990s, a consortium of university researchers used computer models to simulate a “severe and sustained drought” on the river, in an effort to see how water users might respond. The simulated drought used in the exercise would ultimately prove to be eerily similar to the Millennium Drought that took hold less than a decade later. But at the time, notes Brad Udall, a senior water and climate research scientist at Colorado State University, barely any water managers bought into the drought-simulation effort. “The academics wanted to go push all this stuff, but they couldn’t get any decision makers to participate,” he says. “Nobody wanted to lay their cards out.”
If there’s one up side to a 19-year drought, it may be that it has opened up conversations that wouldn’t otherwise be happening. The players are increasingly willing to lay their cards on the table. And the past 19 years have shown that some problems on the Colorado can be addressed, for better or worse, not through radical change but through incrementalism, with the stakeholders gradually playing one hand after another.
But now the stakes are getting higher. Even as representatives of the seven states were in the midst of negotiating the drought contingency plans, climate scientists were delivering more bad news: The Colorado River Basin may be on the brink of a permanent shift into a much drier reality. In 2017, Udall and Jonathan Overpeck, now the dean of the University of Michigan’s School for Environment and Sustainability, found that increasing temperatures could cause the flow of the Colorado River to decline by more than 20 percent at mid-century and 35 percent at the end of the century.
“I don’t care what level of demand management you do,” says Arizona attorney Culp, “that’s a really big problem.”
The states’ negotiators will not get much reprieve before they have to tackle the next round of even tougher questions: The provisions of both the 2007 shortage guidelines and the arduously negotiated DCP will expire in 2026, and the states have agreed on the need to open negotiations for a follow-on agreement just a year from now, in 2020. That next phase will likely serve as the forum for tackling the bigger issues on the river.
“We have to find a way to permanently reduce our demands, and find a way to augment our supply,” says Kightlinger of California’s Metropolitan Water District. That effort, he says, won’t be fast or easy— and Dave White of the Decision Center for Desert City suggests it might require “recalibrating the entire system to what we think is the new availability of water.”
Are people willing to commit to a recalibration or radical overhaul of the way the river is managed, or will they simply adopt a more ambitious follow-on to the operational “updates” of the 2007 interim shortage criteria and the drought contingency plan? A wholesale revamp of the Law of the River—what Fulp calls “the start-over scenario”—is politically taboo for water managers.
Yet the DCP may be the first step in subtly steering everyone into that difficult conversation. The emphasis on tackling “drought”—rather than overuse—may have been a considered move on the part of negotiators. “Politically speaking, I think it’s a useful word for the states,” says Kenney. “To the extent that you talk about drought contingencies and shortage, you’re talking about what we’re going to have to do in an emergency.”
The message, he says, is that “the drought is getting really bad, and we have to make some adjustments. But”—at a time when the Colorado River states are running up against the limits of their allocations—“the reality is that it doesn’t take an emergency to get you to shortage. It doesn’t take an emergency to crash the systems. Just business as usual crashes the system” if the drought worsens.
In spite of calls for radical reform on the river, the key to a durable solution—which may ultimately be just as important as a comprehensive solution—could, paradoxically, be to go slow. “Incrementalism allows people to get comfortable with changes a little bit at a time,” says Kuhn of the Colorado River Water Conservancy District. “And I actually think the incremental change will happen as fast as necessary to adapt to the real-world conditions.”
That approach is obviously not without its risks. The primary result of all the negotiations that have occurred since 2003, which have all but consumed the lives of those involved in them, is that water managers have so far managed to push off a shortage declaration by the federal government by just three years. If negotiators continue to work incrementally, will they be able to keep pace with how quickly the system is changing?
No one knows, and the river isn’t telling. But for now, the DCP process has bought everyone a little time to catch their breath. “[DCP] will get the risk back down,” says Fulp. “It will give us that time to really open up the dialogue on much bigger, and much more difficult, issues.”
On the Colorado River, Change Is the Constant
After nearly 16 years of negotiations, water managers seem to have staved off disaster—for now. Will the next round of negotiations, which begins in 2020, be able to keep pace with how quickly the Colorado River system and conditions in the basin are changing? Dr. Jim Holway of the Babbitt Center for Land and Water Policy thinks it’s going to take significant change. “I believe we will need institutional, policy, and infrastructure changes to sustainably manage the river,” Holway says. Citing challenges including climate change, highly variable conditions, population growth, conflicts over the Law of the River, and increasing water costs, Holway explains that the Babbitt Center exists to recognize and address these challenges, with a particular focus on connecting land use decisions and sustainable water management at the local level. Looking beyond 2026, when both the interim shortage guidelines of 2007 and the proposed DCP modifications expire, Holway identifies a central question: “How do we best prepare for this future, and how do we ensure our policies and decision makers at every level are up for the challenge—and able to quickly adapt as conditions change?”
Matt Jenkins has been covering the Colorado River since 2001, primarily as a longtime contributor to High Country News. He has also written for The New York Times, Smithsonian, Men’s Journal, Grist, and numerous other publications.
Photograph: Fishing boat in the Colorado River Delta. Credit: Pete McBride
References
Hiltzik, Michael. 2017. “As Political Pressure for Approval Intensifies, the Case for a Big Desalination Plant Remains Cloudy.” Los Angeles Times, May 19, 2017. http://www.latimes.com/business/hiltzik/la-fi-hiltzik-desalination-20170521-story.html.
Pitzer, Gary. 2017. “The Colorado River: Living with Risk, Avoiding Curtailment.” Western Water, Fall 2017. https://www.watereducation.org/western-water-excerpt/colorado-river-living-risk-avoiding-curtailment.