City Tech
“What gets measured, gets managed,” goes the business truism. The idea applies to the design of cities and infrastructure, too. And the emergence of big data—massive sets of raw information made possible by new collection and storage technologies—is making possible new measurements that can inform how state transportation agencies plan and manage their projects.
Consider the work being done by the State Smart Transportation Initiative. Founded in 2010 at the University of Wisconsin, SSTI uses new data troves to guide real-world land use and planning decisions. By combining and analyzing data on questions ranging from how people access transit stations to how easy it is for them to get to work or the grocery store, SSTI is shedding light on patterns that can inform future decision making.
In 2018, SSTI began operating in partnership with the nonprofit Smart Growth America (SGA), whose programs include serving as a resource for state departments of transportation. SGA had collaborated with SSTI on multiple editions of The Innovative DOT: A Handbook of Policy and Practice, a guide for “for DOTs committed to innovative excellence.” The partnership now works with more than a dozen transportation agencies, functioning as a kind of policy knowledge base and providing direct technical assistance.
One key to making the most of big data is finding the right framing. “Accessibility means looking at ‘how accessible is this place?’ as opposed to ‘how fast are the cars going on a certain part of road?,’” explains SSTI Director Eric Sundquist. This more holistic approach is not a new idea, but it’s one that’s gaining momentum, partly because of richer data and more sophisticated tools for sorting it. In recent research, SSTI defined accessibility as “the ease with which people may reach opportunities such as jobs, stores, parks, schools, and other destinations. ‘Ease’ is measured in terms of travel time, with some adjustments to account for how travelers use the system.”
Among other projects, SSTI has been working with the Virginia Department of Transportation, whose Smart Scale program draws on a range of big data to “score” transportation proposals submitted by counties and municipalities on their likely ability to improve accessibility to jobs. The most recent round also incorporates access to non-work destinations such as shopping and parks.
As an example, an SSTI planning exercise focused on improving non-work-destination access in Vienna, Virginia. One track of analysis explored how beefing up a walking network and bike path could better connect the town’s main street to other neighborhoods. But another track considered a scenario that involved a shift in land use: encouraging the commercial development of an underused area on the southern edge of town. The latter actually led to higher-scoring accessibility improvements than the hypothetical transportation projects.
This scoring scheme draws on population, employment, and land use data; auto data; transit service data that’s now largely reported in a consistent format thanks to Google Maps; and bike and pedestrian data. Depending on the project, more data can be added, like job categories and neighborhood income. This opens up broader thinking about how “accessibility” can be improved, measuring whether the best option is building new pedestrian infrastructure or working to place a grocery store in a food desert.
“We’ve made people aware of this in our community of practice,” Sundquist adds, so that other DOTs can build on the same ideas. And indeed, transportation officials from Hawaii recently worked with SSTI to try to take the scoring process “a step further,” he continues. “We scored all their projects on a weighted accessibility basis. So if a project provides more access by transit in relation to auto, it will suggest how modes might shift.” The state is evaluating SSTI’s results now.
Such data represent both improvements on existing information-gathering methods and measurements that are altogether new, observes Amy Cotter, associate director of Urban Programs at the Lincoln Institute.
For example, she says, planning decisions have often relied heavily on transit survey results, which are “expensive to collect and sometimes questionable.” So the emergent technologies SSTI is harnessing—including “trip-making data” culled from services that aggregate information from GPS-enabled vehicles, navigation devices, and even smartphone apps—are an enticing alternative. “These new data are providing better information at lower cost to prepare agencies, planners, and state DOTs to make better decisions,” Cotter says.
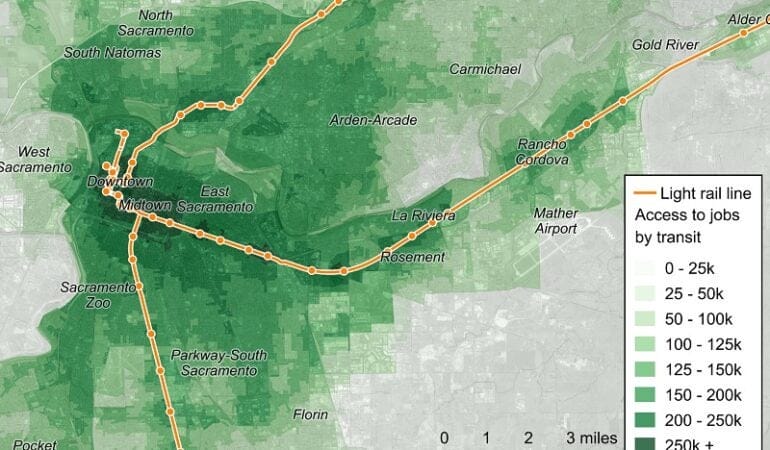
The Lincoln Institute partnered with SSTI in a 2017 project, “Connecting Sacramento,” along with a variety of public and private entities and stakeholders. The resulting study, which catalyzed much of SSTI’s more recent work, sought to assess how these new data sources, and new tools for understanding data, could help improve transportation policy.
The Sacramento research included a case study on walking trips to and from a particular transit station. SSTI worked with traffic analytics startup StreetLight Data, which has devised methods for assessing GPS signals with machine learning to distinguish walking and biking behaviors. Walking and biking have at times “gotten short shrift” in planning efforts, says Sundquist, precisely “because they’re so hard to measure.” So adding this new information to other transportation and land use data sets can lead to new discoveries. In this case, the data pointed out an unexpectedly high percentage of foot trips between the transit station and a particular cluster of office buildings. This was surprising, given that the buildings not only had ample parking, but also were accessible on foot only by way of a single route—across a freeway. The study argued that, in light of this finding, improved or additional access points would improve conditions for current commuters and encourage more to join in.
Such analysis, of course, can often be miles ahead of the realities facing a state department of transportation. But programs like Virginia’s Smart Scale rating system suggest what big data analysis might lead to. Continuing advances in data collection and analysis should mean we will be better able to evaluate the impact of any given project, and better able to compare that to what was predicted—and adjust for the future.
The “what gets measured gets managed” cliché is sometimes used, inappropriately, to argue that what isn’t (or can’t be) measured also can’t—or even needn’t—be managed. But as Sundquist argues, these new forms of transportation data and analysis can be considered as an opportunity. They can reveal practical, actionable information. And they can also help planners, transportation managers, and others think creatively about what they wish they could measure next.
Rob Walker is a journalist covering design, technology, and other subjects. His book The Art of Noticing will be published in May 2019.
Image: Mapping and data analysis by the State Smart Transportation Initiative can help transportation officials make more informed decisions. This map shows transit patterns in the Sacramento area. Credit: State Smart Transportation Initiative